![Solana [SOL] Bullish Rally Faces Key Resistance Zones Amid Speculative Optimism](https://i0.wp.com/en.coinotag.com/wp-content/uploads/2024/05/cryptocurrencies-14.webp?fit=1792%2C1024&%23038;quality=70&%23038;ssl=1)
Solana [SOL] Bullish Rally Faces Key Resistance Zones Amid Speculative Optimism
- Solana is demonstrating significant bullish signals, yet the possibility of a reversal cannot be ignored.
- The On-Balance Volume (OBV) range movement suggests a potential slowdown in the bullish trend.
- Solana [SOL] is currently at the critical $170 resistance level, a barrier that previously halted upward momentum in late May and early June.
Explore the current bullish trends and potential reversal points for Solana, based on recent price movements and market signals.
Critical Resistance Levels and Market Dynamics
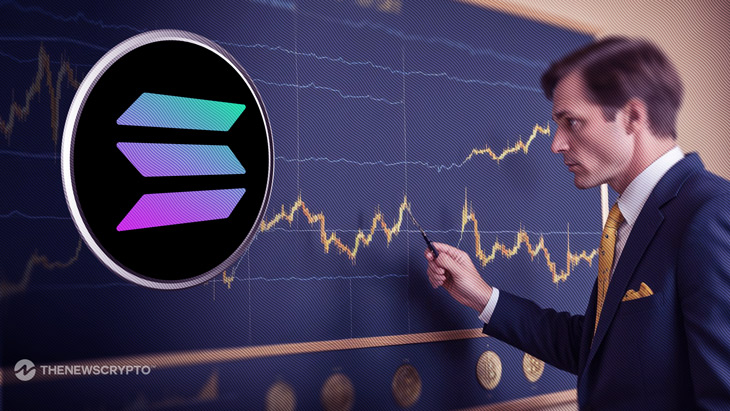
Solana has recently achieved significant gains, trading within the crucial $170 zone, a resistance area that halted the bulls earlier this year. Market analysts have noted the potential for Solana to surge toward the $176 mark, driven by a substantial cluster of liquidity. While a daily close above $175.6 could signify a bullish market structure, traders remain cautious. The key question remains whether this rally can sustain itself and push toward the $200 mark, or if bears will regain control.
Analyzing Key Resistance Levels Ahead
The historical $70-$173 zone remains a critical pivot point, having acted as both support and resistance since mid-March. Furthermore, the $190 resistance area, marking the mid-May peak, is another crucial level to monitor. Fibonacci retracement levels indicate that the 78.6% retracement has been robustly defended, suggesting that the long-term (weekly) outlook remains bullish, even while the daily outlook has already turned positive after surpassing the $154 high.
Market Sentiment and Technical Indicators
Technical indicators further reinforce the bullish scenario. The daily Relative Strength Index (RSI) suggests ongoing upward momentum as the bulls dominate. Additionally, the OBV trend is rising, although it must overcome resistance levels from late March to confirm a breakout beyond $170 and $190. The OBV indicating consistent buying pressure is a crucial signal for market participants to gauge the potential for future price movements.
Open Interest and Speculative Sentiment
Speculators are expressing strong bullish conviction, as evidenced by the rapid increase in both price and Open Interest since July 10th. The current Open Interest stands at approximately $2.4 billion, reflecting levels seen in April and early June. However, while these indicators are positive, they do not conclusively guarantee a breakout. Traders should remain vigilant, particularly around key liquidity pools.
Potential Reversal Points
Analysis of liquidation levels identifies potential reversal areas, notably around $164.6. Prices, however, have surged past this level, underscoring bullish strength. Similar caution is advised near the $177 and $185 liquidity pools, where overextended bullish action could prompt pullbacks as liquidity targets are met. Such scenarios emphasize the need for strategic trading and market vigilance.
Conclusion
In summary, Solana is currently exhibiting robust bullish signals with significant upward momentum and supportive technical indicators. Key resistance levels, namely at $170 and $190, along with notable liquidity pools, present potential reversal points that traders should monitor. Maintaining a cautious yet bullish outlook, traders can navigate these movements by aligning their strategies with prevailing market sentiments and indicators, ensuring well-informed trading decisions.
The post Solana [SOL] Bullish Rally Faces Key Resistance Zones Amid Speculative Optimism appeared first on COINOTAG NEWS.