Bitcoin Price is Playing Above the Important Support; Is the Time to Long BTC?
The post Bitcoin Price is Playing Above the Important Support; Is the Time to Long BTC? appeared first on Coinpedia Fintech News
The Bitcoin price is facing some extra upward pressure as the token is printing constant bearish candles after failing to surpass $72,000 for over a month. The bulls are trying hard to keep up the bullish momentum, but the bears appear to be poised to restrict the rally below the major resistance. With this, the final resistance zone has become more rigid after the BTC price faced multiple rejections and a massive bullish push is required to slice through the zone.
The BTC price hit the local support just above $60,000, a couple of times but the latest bearish push compelled it to drop below the levels. This move has weakened the bulls to some extent, as the upward pressure is expected to escalate further. However, on the other hand, the traders have become pretty uncertain about the next trend as both shorts and longs pile up to some extent.
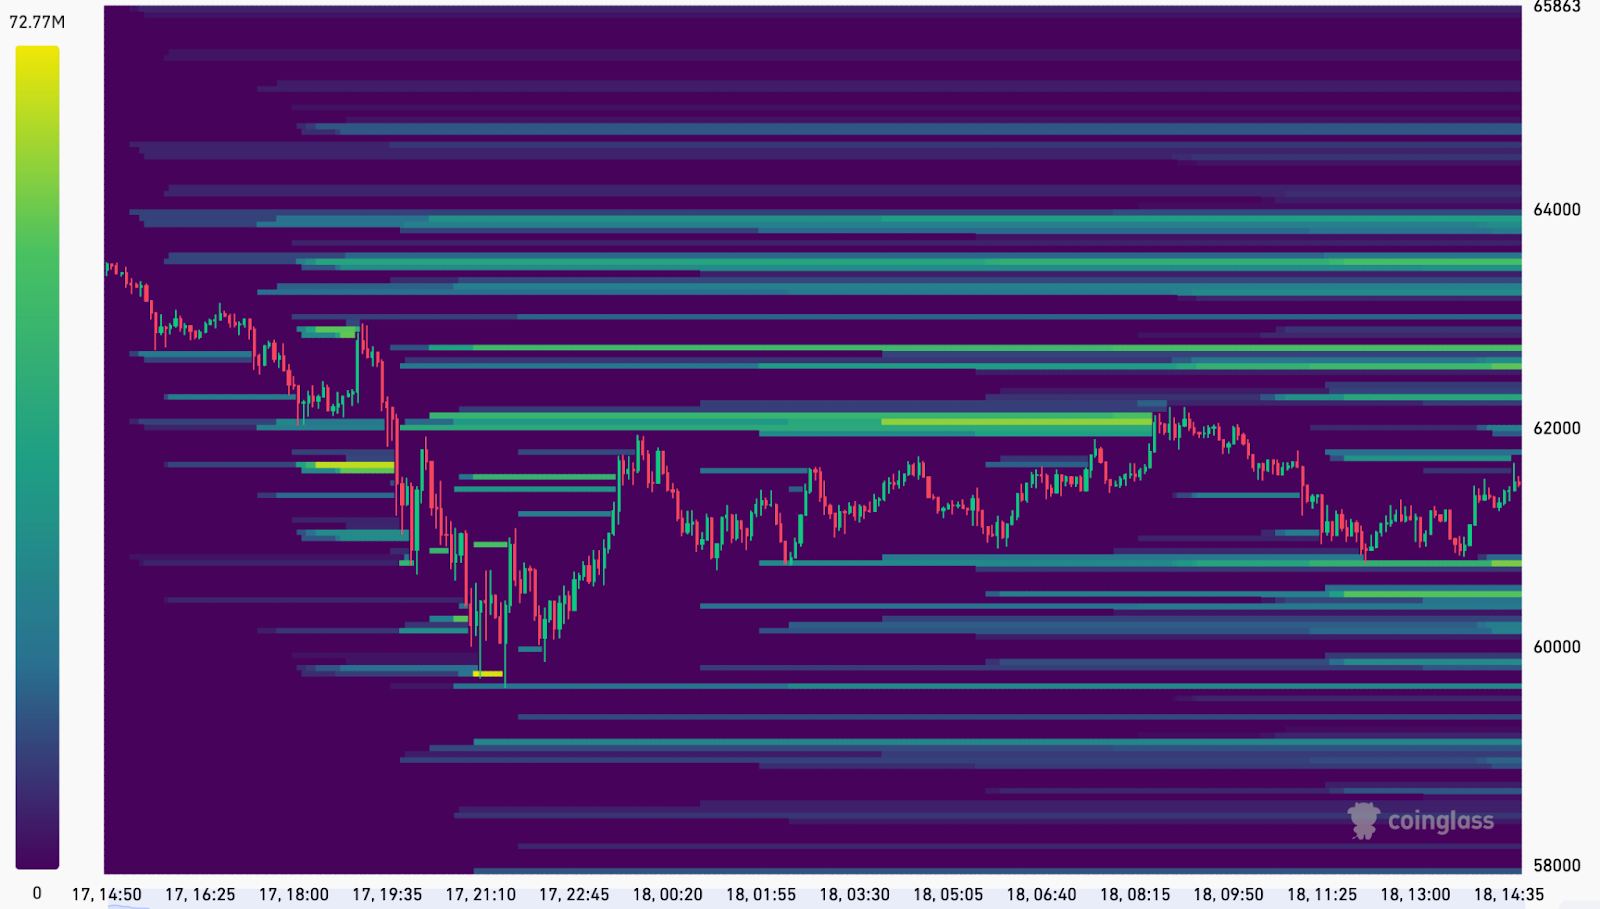
The liquidation heatmap of Bitcoin shows the formation of clusters around $60,758 and later at $60,475 where nearly $55.81 million and $55.35 million shorts are placed as of now. Interestingly, a similar cluster was formed at $62,063 and $62,119.86, with more than $120 million liquidated as the BTC price hit these price levels. However, the next resistance level could be around $62,500 to $62,700, where more than $110 million is placed.
The market sentiments are quite bearish right now and hence the upper cluster is yet to thicken a bit. It is now very important to closely observe the lower cluster, which may offer a slight push if these shorts get liquidated. Therefore, yet another bullish push may be triggered but if the buying volume escalates, then a rise beyond $61,800 or even $62,000 may be expected.
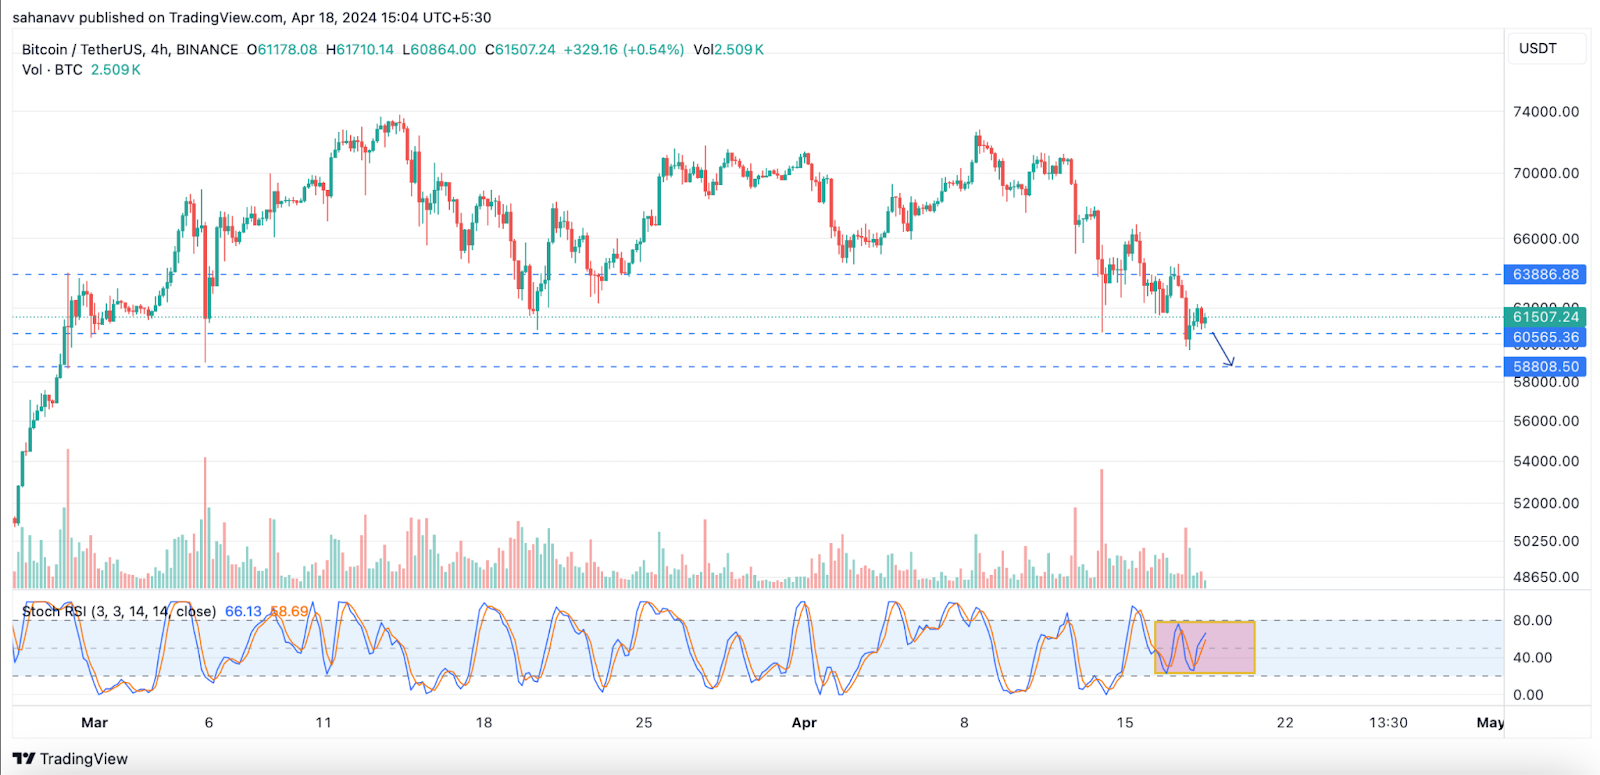
The short-term price analysis displays the price in the middle of a steep descending trend and one final push towards the lows may lead the levels towards the lower support at $58,800. The stochastic RSI in the 4-hour chart has been squeezed between the resistance and support levels, which suggests a significant drop in bullish & bearish power. Therefore, this substantiates the bearish claim.
Hence, the Bitcoin (BTC) price may fall below $59,000 in the coming days, which may attract a bullish trend as the token marks levels lower than this.