Polkadot price analysis: Depreciation of DOT occurs following a bearish reversal to $6.61
The hourly and daily Polkadot price analysis indicates that the price is decreasing. This is due to the fact that the bullish momentum has allowed the bears to take flight, and red candlesticks have returned to the price charts. More sellers are disrupting the price flow, and DOT is encountering bearish resistance. The price had been rising fairly steadily, but as the bears pushed through, it has since decreased to $6.61.
DOT/USD 1-day price chart: Coin moves downhill as a result of a recent shock
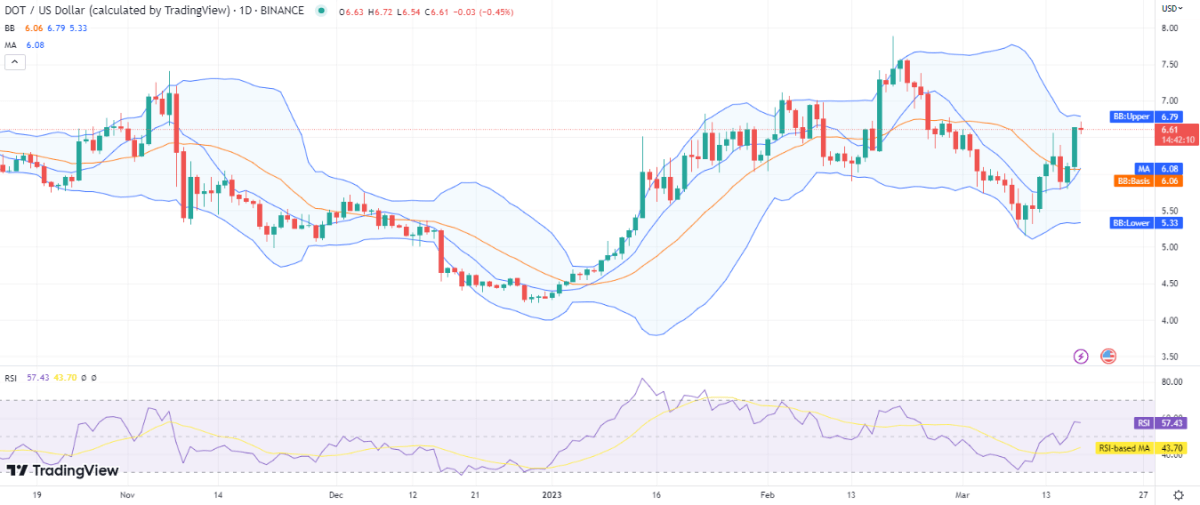
After a brief resurgence from the bears earlier in the day, the price is now moving lower once more. The price can be seen standing at the $6.61 level in the one-day Polkadot price analysis, which supports the decline. If the currency is examined over the past 24 hours, it still makes a 2.95 percent profit. The past week was crucial in raising the value of the cryptocurrency, but today, patterns have slightly changed. Additionally, the moving average (MA) is quite lower than the current price at $6.08.

Additionally, today’s observation of a crossover between SMA 20 and SMA 50 indicates that recovery may once again be possible. Additionally, the Bollinger bands Indicator sets the upper and lower readings for the day at $6.79 and $5.33, respectively, representing the resistance and support levels for the coin’s price function. Additionally, the Relative Strength Index (RSI) value decreased to $57.
Polkadot price analysis: Recent developments and further technical indications
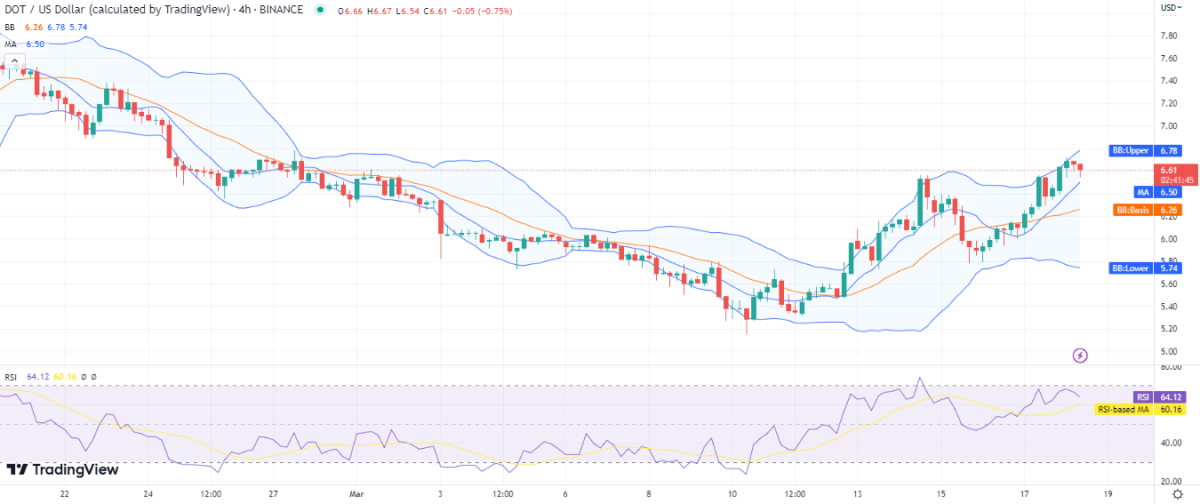
Given that the price has steadily declined over the last few hours, the Polkadot price analysis for the past four hours predicts a bearish pattern. Given that the price was rising early in the day, the downward trend was quite unexpected. Due to the market’s increasing selling pressure, the coin’s price has fallen back to the $6.61 level. The price is higher than the $6.50 moving average mark. As the bearish momentum continues to grow, a further drop in price can be anticipated.

The Bollinger bands average has positioned itself at $6.26 as the volatility has risen. Additionally, the upper and lower values of the Bollinger bands have altered; the upper band is now $6.78, and the lower band is $5.74. The RSI score has achieved a number of 64, which falls within the upper neutral range, and the RSI curve is also descending.
Polkadot price analysis conclusion
The one-day and four-hour Polkadot price analysis has verified that the price has slightly decreased today. On the price chart, the bearish candlesticks have reemerged as the patterns have reversed. The price has been lowered to the $6.61 mark after the bearish comeback. However, there is a possibility that the previous uptrend may return if the current local support holds firm at the current price level.


