Chainlink price analysis: Bears block Bullish momentum from soaring above $8
The bears are standing high, as the Chainlink price analysis indicates a crucial fall in the bullish momentum. Today, the price has fallen to $7.93, and the bears are continuously gaining ground. The price has significantly dropped over the last few hours, but the SMA 20 is still rising higher than the SMA 50. The resistance level is at $8.10, but the most recent figures are in the bears’ favor.
LINK/USD 1-day price chart: A bearish takeover causes LINK to fall to $7.93
The one-day price chart for Chainlink price analysis shows a rising resistance from the sellers’ side. The last week was really bullish for the market, but today’s trajectory has been different. It has been difficult for the bullish trend to advance as the LINK/USD price value has fallen to $7.93. When the moving average (MA) is positioned at the $7.48 level, the cryptocurrency’s volatility is rising.

As the Bollinger bands have been widening, the upper band has moved up to the $8 level representing the resistance, and the lower band has lowered to $6.39 representing support. The Bollinger bands average is settling at $7.24.The Relative Strength Index (RSI) score is also satisfactory for cryptocurrency as it present at index 63 in the upper half of the neutral zone, but its curve is headed downwards.
Chainlink price analysis: Recent developments and further technical indications
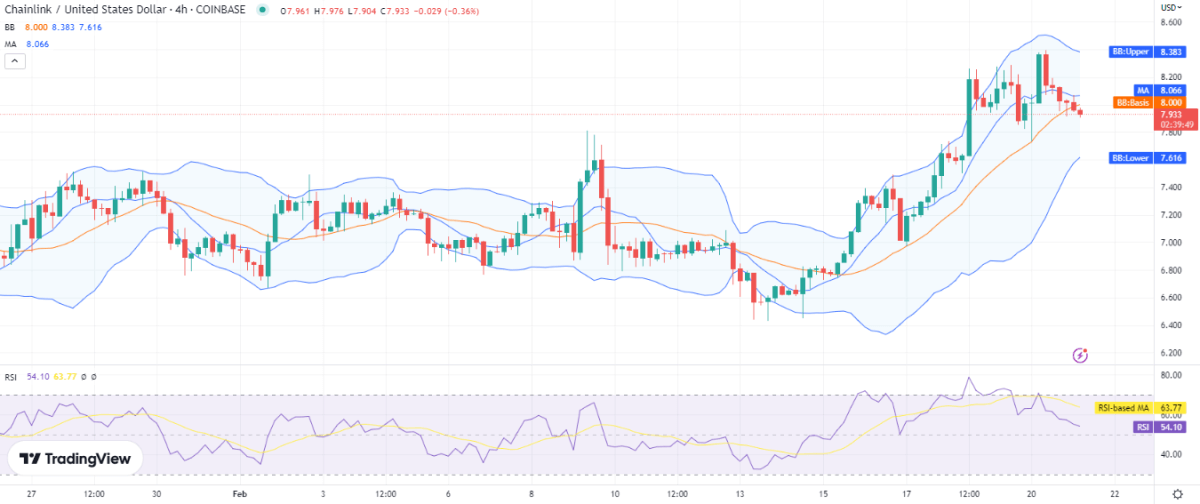
The 4-hour price chart for chainlink price analysis reveals that the price has dropped to $7.93, which is indicating negative trends. The fact that volatility is declining shows us that the Bears’ prospects for success in the future are dim. While the Bollinger bands average is present at $8 value, the moving average (MA) was $8.06, which is slightly higher than the current price level.

The other Bollinger band values are as follows: the upper band is currently touching $8.38, while the lower band is currently touching $7.61. The purple graph depicts a curve that is fast receding, and the RSI score is rapidly dropping; a score of 54 indicates that selling activity is increasing in the market.
Chainlink price analysis conclusion
We can infer from the aforementioned 1-day and 4-hour Chainlink price analyses that there have been more sellers than buyers, which is why the bearish momentum has been so strong. The price levels have dropped to $7.93 today, substantially reducing the positive momentum. If the support remains strong above $7.64, there is a significant chance that the bulls will soon start rising once more. A shift towards the bulls is to be anticipated as a result of the decreasing volatility, which also points to a decline in the negative momentum.


