Uniswap price analysis: UNI suffers a downtrend at $7.24 after a bearish strike

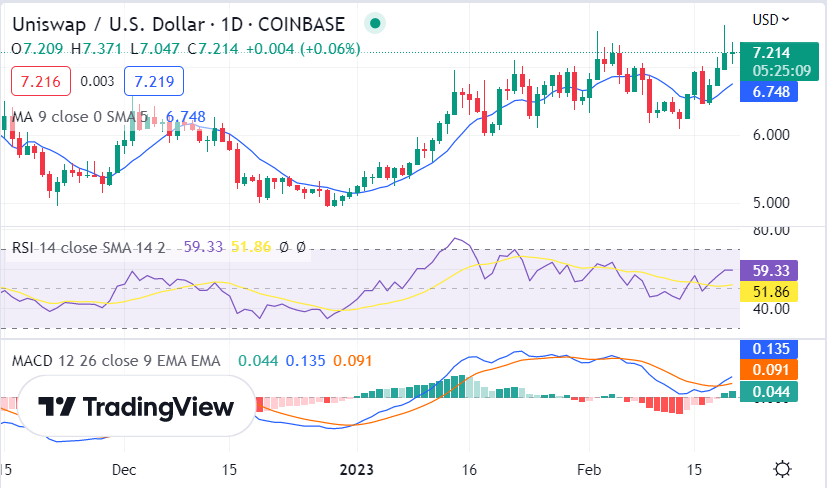
Uniswap price analysis shows a bearish movement, with UNI/USD suffering a downtrend at $7.24 after a bearish strike. The UNI/USD pair is currently trading at the support level of $7.08 and may fall further if push comes to shove. The resistance for UNI/USD is currently at $7.36, which could be a possible area where bulls might try to make a stand. The bulls were in control at first, however, the bears are now in control and any attempt at a bull run seems unlikely at this moment.
UNI/USD 1-day price chart: Bearish wave extends as price steps to $7.24 low
The one-day Uniswap price analysis indicates that the prices have been trading between a range of $7.08 to $7.36 and the prices have declined by 2.09 percent in the past 24 hours. The digital asset has a market capitalization of $5.5 billion while the total trading volume sits at $157 million. The bulls need to break the resistance level of $7.36 to have a chance at regaining control of the market, however, this needs to be done soon or else the prices may fall further.

The technical indicators currently show a bearish sentiment with moving average convergence/divergence (MACD) trending lower. The MACD line and the signal line are below zero which indicates a strong bearish momentum. The relative strength index (RSI) is at 59.33 indicating that the prices may remain range bound for some time as it hovers near the oversold territory. The moving averages are all trending lower and the 20-day moving average has crossed below the 50-day moving average, which is a bearish sign.
Uniswap price analysis 4-hour chart: Bears overtake after the bullish opening
The 4-hour Uniswap price analysis shows the price has been decreasing for the past 4 hours after the bullish recovery observed earlier during the night, which continued for the past hours consecutively. The market received a bearish shock, as the bears have taken over again, and selling activity is on the rise again as the price is on a decreasing trend due to the selling pressure.

The RSI indicator is currently showing signs of bearish divergence as it has failed to make any higher highs while the price has made higher highs. This suggests that the current rally may be running out of steam and that a move to the downside could be on the cards in the near term. The MACD indicator is currently in bearish territory, however, it is beginning to flatten out which suggests that momentum may be starting to turn in favor of the bulls. The UNI/USD is trading below the moving average indicator, which is a bearish sign.
Uniswap price analysis conclusion
Overall, the Uniswap price analysis shows that the prices are currently in a bearish trend and there is a chance that it might reach $7.08 as its support level if the selling pressure continues. We can expect to see some upside movement if the bulls make an attempt to take control of the market and break the resistance level of $7.36.


