Bitcoin price analysis: BTC rises to a new all-time high of $24,958 after a bullish run
The Bitcoin price analysis for today shows that the cryptocurrency is trading in a range-bound market. The current price of BTC is $24,458 and appears to be on an upward trajectory. The BTC/USD pair has seen a steady rise for the past 24 hours and is currently trading above $24,000 which is an encouraging sign for Bitcoin investors. However, today’s bearish sentiment was seen in the altcoins and tokens market.

The resistance level for Bitcoin is at the $25,0934 level and if breached, it could lead to a further rise in the price of BTC. On the other hand, if support is found at the $23,915 level, then it would indicate that investors are not yet ready to commit to higher prices and Bitcoin may return back to its previous levels.
The trading volume of Bitcoin has also seen an increase over the past 24 hours to $33 Billion, indicating that more investors are getting involved in the market. This is a positive sign for investors looking to capitalize on the current bullish trend of Bitcoin. The market cap of Bitcoin is currently at $480 Billion, and this is an indication of how far the cryptocurrency has come in terms of market capitalization.
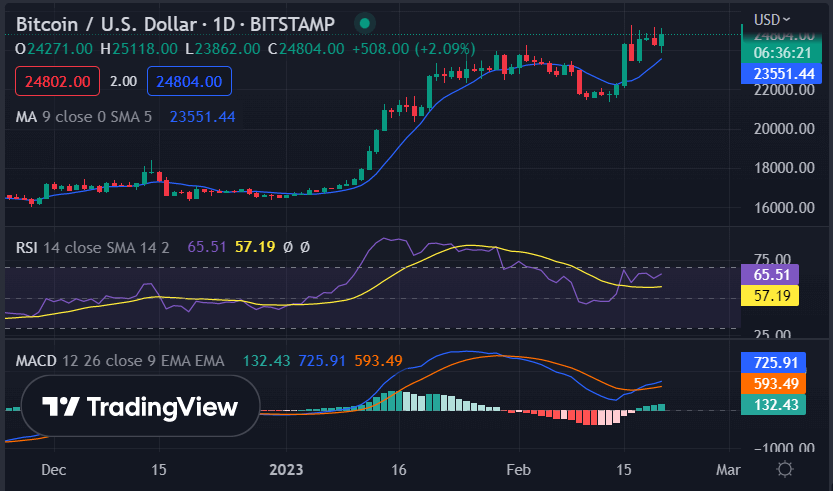
BTC/USD 1-day price chart: Can bulls surpass the resistance of $25,093
The 1-day price chart for Bitcoin price analysis shows a significant increase in price. As BTC/USD is floating at the $24,958 level, The buying pressure is intensifying as buyers try to break the resistance level of $25,0934. If this occurs, then it is likely that Bitcoin will continue its bullish run and a new all-time high may be reached. The BTC/USD has gained more than 0.30% over the past 24 hours and is showing strong signs of bullish sentiment.

The MACD shows an increasing bullish trend as the histogram color has changed from red to green over the past 24 hours. The RSI is currently at 65.51 and is trending higher, which indicates that buyers are in control of the market. The moving average (MA) is at the $23,551 level and is currently trending higher.
Bitcoin price analysis 4-hour chart: The BTC/USD is exhibiting a bullish pattern
The Bitcoin price analysis for the four-hour chart shows that the cryptocurrency is trading in a bullish trend. The bears are again trying to take over the price function as the selling pressure has started, after the surge in price, but the bulls are still in control of the market. The buying pressure is still strong and if the bulls can continue to keep the market above $24,500 then it is likely that a new all-time high may be achieved.

The moving average (MA) is at the $24,666 level and is currently trending higher. The 50-day MA is at $24,666 and is also trending higher, while 200-day MA is at $24,812 and is trending higher as well. The MACD shows an increasing bullish trend as the signal line has crossed above the MACD line. The relative strength index (RSI) is currently at 59.93 and is trending higher, which indicates that buyers are in control of the market.
Bitcoin price analysis conclusion
The overall sentiment for Bitcoin is bullish and the price analysis shows that the cryptocurrency is trading in a range-bound market. The resistance level of $25,093 needs to be broken if BTC/USD is to continue its recent rally. If buyers succeed in breaking this resistance level then it could lead to a further rise in price and potentially a new all-time high.
While waiting for Bitcoin to move further, see our Price Predictions on XDC, Polkadot, and Curve


