Chainlink price analysis: LINK shows a strong bullish at $8.15 after the latest surge
Recent Chainlink price analysis is in bullish sentiment as the LINK price surged to $8.15 after experiencing a minor dip near $7.53, which is its immediate support level. The bullish have been in control since the LINK/USD pair broke past the resistance level of $8.22 on February 17th.
The bullish trend was further strengthened with an increase in trading volume, which indicates strong investor confidence in the cryptocurrency. Currently, the trading volume is at $3.94 billion. The market cap for the LINK/USD pair is currently at $4.13 billion and it remains one of the most actively traded cryptocurrency pairs in the market.
LINK/USD daily price chart: The coin has surged by 6.94% in the last 24 hours
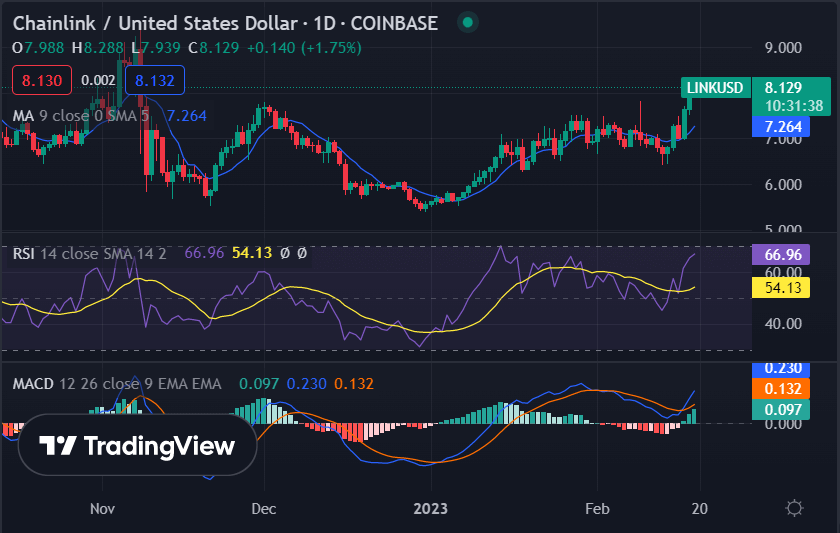
The daily price chart of the Chainlink price analysis shows a near 6.5% surge in the last 24 hours, as the coin surged from $7.53 to its current trading level of $8.15. The market has formed a series of higher lows, indicating the strength of the bullish trend in the market. The next resistance level for the pair is at $8.22, while the immediate support level remains at $7.53. The moving average indicator is also indicating a bullish trend for the pair, with the 50-day moving average pointing upwards.

The Technical indicator for the LINK/USD pair is currently giving a bullish signal as the RSI indicator has risen above the 60.00 level and is currently trading at 66.96. Moving Average Convergence Divergence (MACD) currently indicates a bullish trend on the daily chart as it gives a positive crossover with the significant buying signal line (green) and overselling line (red). However, both the lines are trading closer to each other and can negatively affect the short term.
Chainlink price analysis 4-hour chart: The support level for the LINK/USD pair is present at $7.53
The 4-hour Chainlink price analysis shows that the market is in a strong uptrend as the price has risen above the $7.53 support level. The market bulls and bearish have been battling for control but the bulls have been able to push the price up to the $8.15 level. The market looks set to continue its upward trend as the bulls remain in control.

The MACD is currently in the bullish zone as it gives a strong positive crossover with the significant buying signal line (green) and overselling line (red). The RSI indicator is currently trading at 71.37 which indicates that the market is overbought. The moving average is currently at $7.98 and is sloping upwards which indicates that the trend will continue to remain bullish in the near term.
Chainlink price analysis conclusion
Overall Chainlink price analysis shows that the LINK/USD pair is in a strong bullish trend and is expected to continue its upward movement in the near term. The market appears to have formed strong support levels at $7.53 and resistance levels at $8.22 which will be important points for traders to watch as the market moves forward. The technical indicators are pointing towards a bullish trend and point to more upside in the near future. Despite the potential for a short-term dip, the overall outlook remains positive for LINK/USD in the near future.


