Open Campus Price Analysis: EDU corrects above $1.35 after spiking high
The Open Campus price analysis reveals the cryptocurrency is under correction today after rallying high yesterday. The bullish momentum sparked, and the coin rushed towards $1.47, just shying away from its record high yesterday, but today the trend reversed, and bears are defining the price function. The appearance of selling pressure was natural after a continuous bull rally for more than 24 hours. The price has covered a downward range today from $1.46 to $1.38, which is quite a nominal decline, but still, the price is on the higher side comparatively.
EDU/USD 1-day price chart: EDU price shows a downward tendency
The 1-day Open Campus price analysis shows bears are dominating the market today, as bears have managed to take over the price function during the last eight hours, as the price has undergone a reduction today. Although the coin gained a massive 15 percent yesterday, today’s trend has been in favor of bears. The recent bearish momentum has brought the price down to $1.38 at the time of writing. The trading volume has gone up by 371 percent, while the market dominance for Open Campus (EDU) has been 0.02 percent.
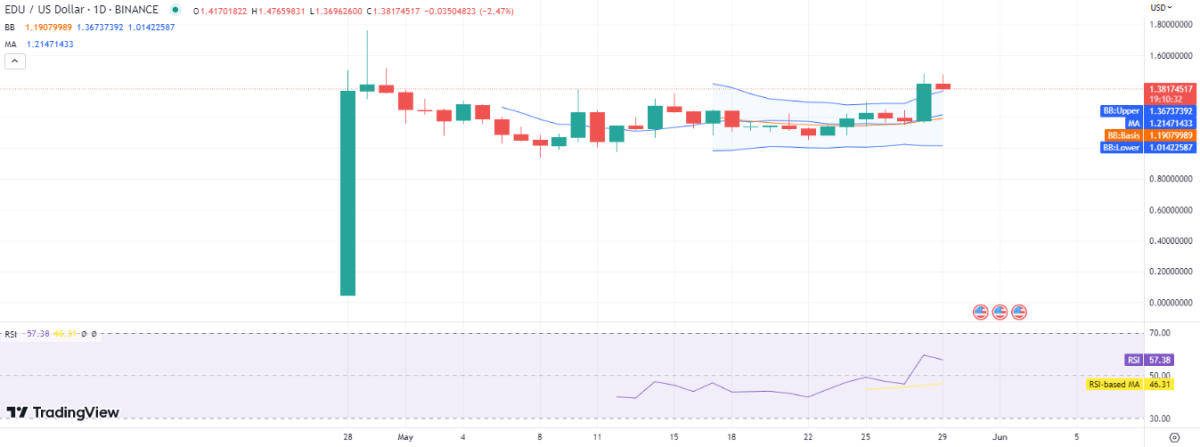
As the price, after hitting a higher spot, has receded today, so the volatility for the cryptocurrency is also on the increasing side. The upper Bollinger band is at $1.36, and the lower band is at $1.01, making an average of $1.19. The relative strength index (RSI) has also come down to index 57, indicating selling activity in the market.
Open Campus price analysis: Recent developments and further technical indications
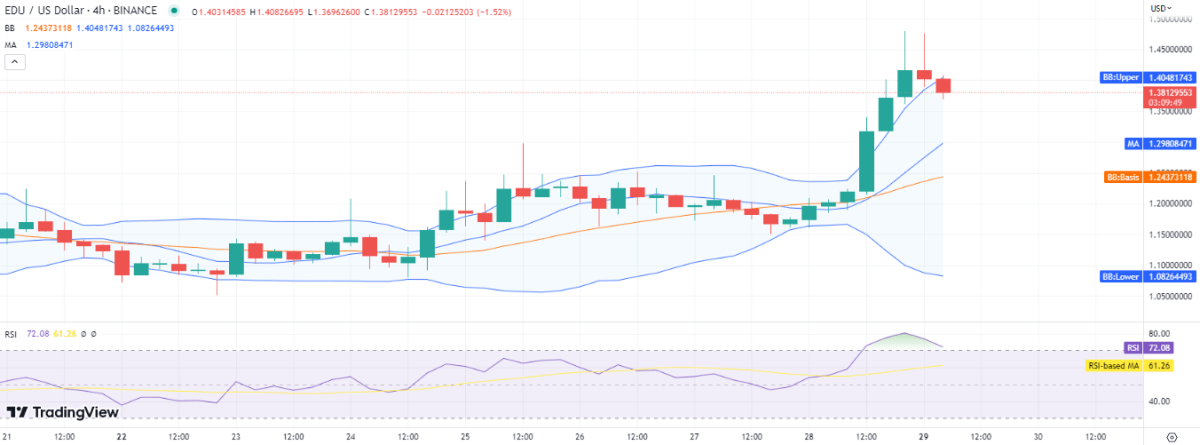
The 4-hour Open Campus price analysis shows that cryptocurrency is following a downward track as bears have shown strength over the past eight hours. However, the decline in the price level is not steep, and the selling pressure hasn’t taken over completely. The price has come down below the upper limit of the volatility indicator as the bulls might be exhausted after a 28-hour-long rally.

The volatility is significantly high, and the Bollinger bands are maintaining the volatility level as the upper band is at $1.40 and the lower band is at $1.08. The RSI is maintaining its curve above the border of the overbought sold region as it is present at index 72, implying that the coin is overvalued at the moment.
Open Campus price analysis: conclusion
The Open Campus price analysis shows a downturn in the EDU/USD price has been observed today, as the bears have taken over the price function after yesterday’s high spike. The price has been reduced to the $1.38 level after the reversal in trends took place. But chances for a further decline are not very strong, as bullish support is also present nearby, and the market sentiment is not completely negative. We anticipate the EDU price to remain above $1.28 today.