Dogecoin price analysis: Bullish flight at risk after bears restrict price under $0.088
The Dogecoin price analysis report shows that the bulls have made a concerted effort to maintain their streak, and that they have thus far been successful enough as the price has reached a high of $0.088 today. Since February 11, 2023, the price has been growing steadily, indicating an increase. There have been periods when the price corrected in a bearish direction, but overall, bulls have dominated. But now, bulls are active and leading the price function for the second consecutive day.
The past few hours had observed a continuous bullish streak that was on course to go above the current resistance, i.e., $0.089. However, the bears have stopped the price levels from rising any further, and a correction has just begun.
DOGE/USD 1-day price chart: DOGE bulls mark 2.64 percent gains
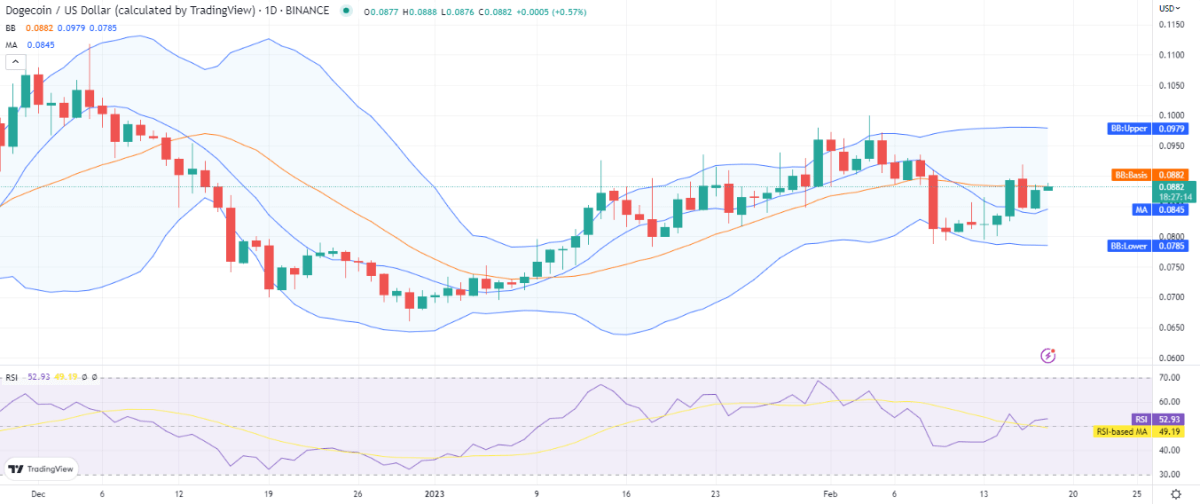
The bulls have effectively created a short-term upward trend line on the 1-day price chart for Dogecoin price analysis, as the price has been steadily rising. The bulls have also managed to avoid the bears, who had been in the lead for the previous few weeks due to increased selling activity seen in the market. The next obstacle that bulls will run into is at $0.089. Bulls are pushing the price function upward.

The price is trading above the moving average (MA) level, which is present at the $0.0.84 mark. As the price has been on a continuous increase for the last week, the Bollinger bands also show high volatility, with both its limits shifting apart. The upper band is present at $0.097, and the lower band is present at $0.078 representing support for DOGE. The relative strength index (RSI) score has improved to index 52 after the recent bullish trend.
Dogecoin price analysis: Recent developments and further technical indications
The 4-hours Dogecoin price analysis is predicting a decline in the price, as the bears are regaining their strength after a continuous defeat. The price has decreased to $0.087, which is surprising considering that the past few hours have seen the bulls maintaining their lead successfully.

The moving average (MA) value of $0.086 is still below the current price value, as the bulls have been at reign previously. Meanwhile, the Bollinger bands are maintaining an average of $0.087, at the time of writing.
The other values related to Bollinger bands are equally important in predicting the ongoing trend, and the upper band is at $0.090 while the lower band is at $0.084. Meanwhile, the RSI score has also been moving horizontally flattening out at index 57, but still holds a secure place.
Dogecoin price analysis: Conclusion
The 1-day and 4-hours Dogecoin price analysis is directing us that the bears are trying to take charge again. The bears are giving resistance to the bullish uptrend and have successfully interrupted the bullish streak just when the price has gone above the last resistance mark. The bears have caused the price to lower to $0.087, and further downfall can be expected if more sellers enter the market.


