Cardano price analysis: ADA shows uptrend at $0.4097 after a bullish engulfing pattern
The Cardano price analysis is showing bullish signs once again after an extended period of consolidation. The price of ADA/USD started to rise later in the day, and the bulls are successfully continuing their endeavor today as well, as the price has increased significantly over the past few hours. The next resistance level for ADA/USD is present at $0.4192, and if the bulls can push past this level, we could see even more gains in the near future. On the other hand, support for ADA/USD is currently located at $0.3883
Most of the cryptocurrencies today are in the green zone, The top coins Ethereum, Bitcoin, and ADA are also in the green zone. Ethereum is up 5.91%, Bitcoin 10.71%, and ADA 5.19%.
Cardano price analysis 24-hour price chart: ADA curve heads up towards $0.4097 as bulls continue to rally
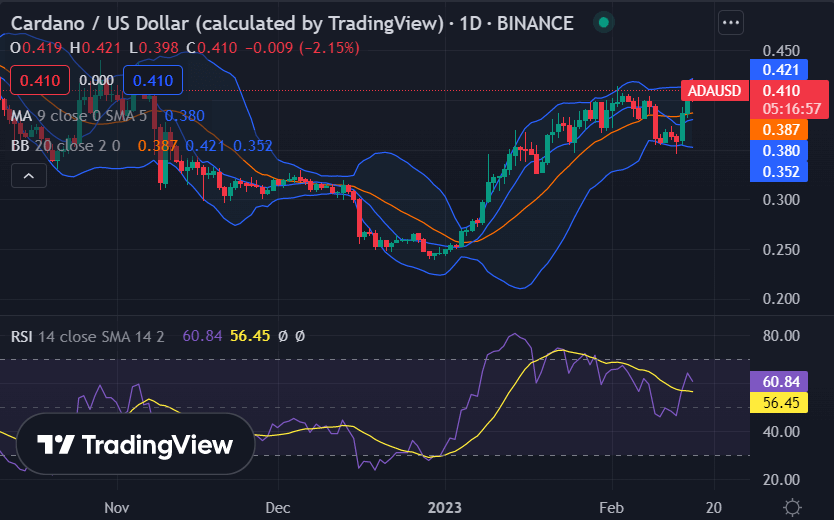
The 1-day price chart for the Cardano price analysis shows that the price has increased today as bulls have taken the lead. The coin is trading at $0.4097 at the time of writing. Due to the recovery process initiated by the bulls, the crypto pair is reporting a 5.19 percent increase in value for the last 24 hours. At the same time, the trading volume has increased to $612 million, and a market cap of $14 billion has also been recorded for ADA/USD.

The volatility is currently moderate, The upper Bollinger band is currently at $0.421, while the lower band is at $0.352. The moving average (MA) is at $0.380 above the SMA 50 curve but is slowly moving downwards. The relative strength index (RSI) is on an upwards curve in the lower half of the neutral zone, trading at index60.84. The RSI is on an upwards curve, hinting at the bullish momentum and buying activity in the market.
Cardano price analysis: Recent developments and further technical indications
The 4-hour Cardano price analysis shows that the price function has been following an upward trend for the last 4 hours, as bulls took charge later yesterday. Previously ADA was on a downtrend for the past few days. Today no bearish hindrance has been observed as green candlesticks are appearing on the 4-hour chart.

The volatility is also high on the hourly chart, the upper limit of the Bollinger bands is at $0.428, and the lower limit is at $0.343. The MA is also trading below the current price level on the 4-hour chart at $0.405. The RSI is trading at a slightly upward curve as its curve became milder recently, currently, at 65.97 in the neutral zone, it is not indicating any extremities as of now.
Cardano price analysis conclusion
The Cardano price analysis suggests that the coin is in bullish momentum after yesterday’s correction. The ADA/USD price is now touching the $0.4097 mark, which is the highest of the last few hours, and it can be expected that it will move up to further highs in the approaching hours.


