Bearish Metrics Counter Bullish Setup for Litecoin
NOIDA (CoinChapter.com)— Litecoin price action meekly followed the wider market trend with a recovery on Aug. 6 before the token pared all its gains on the following day. However, LTC bulls are making another attempt at a rally on Aug. 8, but like several other tokens, face bearish pressure mixed with some bullish cues.
Bearish Metrics Against Litecoin Price
The futures open interest, funding rate, and wallet distribution charts for Litecoin (LTC) highlight the bearish sentiment against the LTC token. Open interest in LTC futures has declined from over $600 million in April to around $180 million by August.

The drop highlights decreased speculative trading activity and a prevailing bearish sentiment. Traders are reducing their positions, reflecting a lack of confidence in LTC’s prospects. Moreover, the price of LTC mirrored this decline, further emphasizing bearish market sentiment.
Lower open interest often correlates with reduced market confidence and falling prices.
The funding rate chart shows fluctuations, though not many journeys into the negative region. Positive funding rates indicate long positions paying short positions, suggesting bullish sentiment. Negative funding rates indicate short positions paying long positions, suggesting bearish sentiment.

Recent spikes in positive funding rates in late July and early August highlight bullish sentiment, but it may not be enough to get Litecoin out of the woods.
The wallet distribution chart from Santiment shows varied behaviors among different holder categories.

Wallets holding 1,000 to 10,000 LTC have shown minor fluctuations with a slight downward trend. Wallets holding 10,000 to 100,000 LTC have seen significant volatility and recent accumulation. Moreover, wallets holding 100,000 to 1,000,000 LTC tokens showed a sudden, suggesting whales are dumping their LTC tokens, a bearish sign.
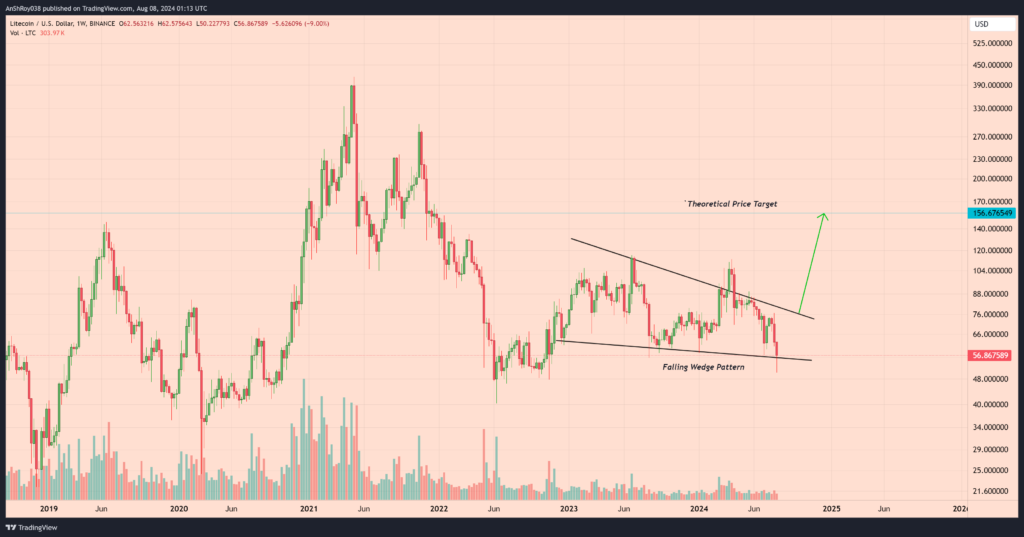
Bullish Technical Setup For Litecoin Price
Meanwhile, the LTC USD has formed a bullish technical setup called the ‘falling wedge.‘
A falling wedge pattern features a pair of converging trend lines connecting lower highs and lower lows, forming a narrowing shape that slopes downward.

The pattern typically suggests that an asset’s price, while consolidating in a downtrend, is losing bearish momentum and preparing for a potential reversal to the upside. Typically, a breakout occurs in the direction of the overall trend, which, for a falling wedge, is upward.
To estimate the price target of a falling wedge pattern, traders measure the widest part of the wedge at the beginning of the formation. They then project this distance upward from the point of the breakout to set a potential target.
An accompanying increase in trading volume can further confirm the reliability of the breakout. Higher volume during the breakout suggests stronger market conviction, supporting the likelihood of a successful price reversal.
According to technical analysis rules, the LTC USD pair could rally over 175% from the current price level to reach the pattern’s theoretical price target near $157.
The post Bearish Metrics Counter Bullish Setup for Litecoin appeared first on CoinChapter.


