Bitcoin Bottoming Out Soon? Analysts And On-Chain Metrics Say Nah
NOIDA (CoinChapter.com)— The recent crash saw major tokens facing a sharp decline, with Bitcoin plummeting below $50,000. This drop, which saw Bitcoin lose around 23% of its value, is the steepest since the COVID-19 market rout in March 2020.
The sell-off triggered over $1 billion in liquidations, heavily impacting leveraged positions. Factors such as a sudden rate hike by the Bank of Japan, which led to a sharp appreciation of the yen, and disappointing U.S. unemployment data contributed to this downturn.
Global market turmoil, exacerbated by geopolitical tensions and economic uncertainty, has heightened investor anxiety, pushing the Bitcoin Fear and Greed Index into “extreme fear” territory.
The Bottom Is Definitely Not In For Bitcoin
Bitcoin’s recent price drop has intensified bearish sentiment. Key on-chain data shows a notable increase in whale deposits to exchanges, indicating that major holders are likely preparing to sell.

Following the BTC price drop, whale deposits to exchanges and inflows to exchanges spiked, suggesting that traders were moving their tokens to the exchange. This activity, combined with the Short-Term Holder MVRV ratio falling below 1, suggests widespread losses among investors.
Historically, a drop in this ratio often triggers further selling as investors seek to cut their losses and exit the market.
The sharp liquidations, amounting to over $1 billion in a day, further pressured the market. These liquidations affected long positions, reflecting a broader risk-averse stance among investors.

Furthermore, analysts like McKenna predicted an extended period of consolidation, with the market potentially entering an accumulation phase. Moreover, Michaël van de Poppe echoed a similar outlook, warning of a binary outcome: either a recovery or a deeper downturn, possibly marking a new cycle low.

Additionally, in the week ending Aug. 3, Bitcoin saw outflows totaling $400 million. Moreover, Bitcoin investment vehicles saw outflows of $380 million in August itself. The manic withdrawal of funds reflects a broader risk-off sentiment in the market as investors pull back from riskier assets amid rising uncertainty
Adverse macroeconomic factors, including rising interest rates and weak U.S. economic data, have heightened market volatility, compounding the bearish outlook. The CBOE Volatility Index (VIX), an index tracking market volatility, has spiked, indicating increased investor anxiety.
Brandt’s Cautious Optimism
Meanwhile, Peter Brandt presented a cautiously optimistic perspective, likening the current market conditions to previous post-halving cycles. He noted the 26% decline from recent highs mirrored the patterns observed during the 2015-2017 bull market cycle.

Brandt’s historical comparison suggests that while the current correction is significant, it aligns with past trends that often precede substantial bull runs. The historical context offers a glimmer of hope for long-term investors.
However, the wider consensus remains that the recent market crash has likely ushered in a bearish phase for Bitcoin and other cryptocurrencies. Hence, BTC prices will likely continue dropping before they bottom out.
Bearish Pattern Sees Bitcoin Price Dropping Below $40K
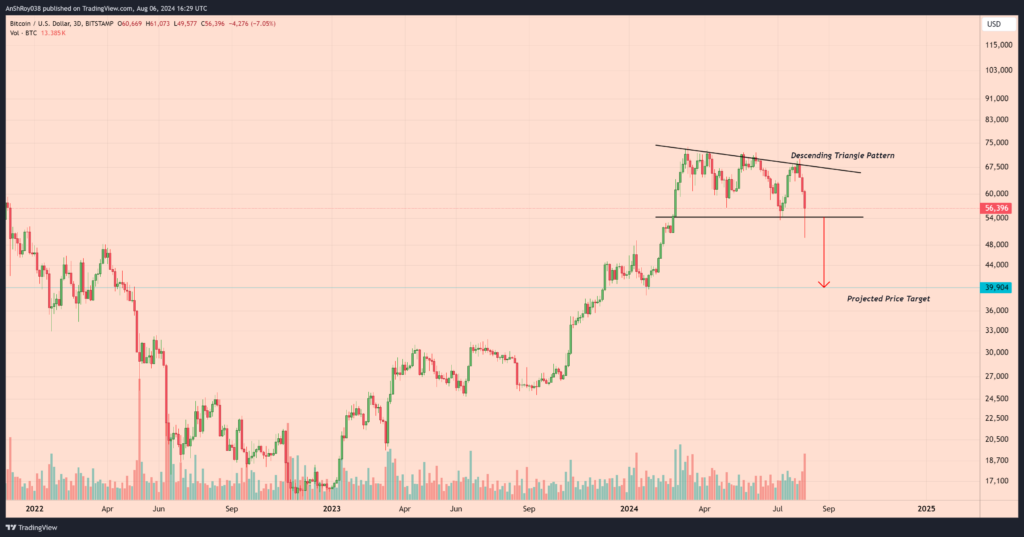
Adding to the headwinds against Bitcoin is a bearish technical pattern called the ‘descending triangle.’

Market analysts often consider the descending triangle a bearish continuation signal.
The configuration features a downward-sloping upper trendline, which gradually reduces the price action’s highs, and a flat lower trendline, which is a consistent support level the price finds difficult to break.
Moreover, the pattern suggests that selling pressure is intensifying, leading to successively weaker rallies. In this setup, traders gauge the potential price target by measuring the maximum height of the triangle at its widest point.
BTC price broke out of the descending triangle pattern, though bulls pushed the token back inside the pattern. However, confirming the bearish setup might result in the BTC USD pair dropping over 26% to reach the projected price target near $39,900.
The post Bitcoin Bottoming Out Soon? Analysts And On-Chain Metrics Say Nah appeared first on CoinChapter.