BONK Price Eyes Breakout After Rising Above Crucial Point
Bonk’s (BONK) price reached a monthly high of $0.000033 on July 21. However, the meme coin could not sustain the price, falling to a weekly low of $0.000025 four days later.
Later, the token attempted to revisit the peak but was rejected after hitting $0.000030. Following the drawdown, BONK has now lost another 4.15% of its value in the last 24 hours. But this analysis explains why the cryptocurrency could be aiming toward a rebound.
Bonk Bullish Reversal on the Horizon?
According to the chart shown below, BONK initially fell below the 20 EMA on July 29. EMA is an acronym for the Exponential Moving Average, a technical indicator that detects trend direction.
Typically, if the price of a cryptocurrency is below the EMA, the trend is bearish. However, a rise above it gives credence to a bullish reversal, which is true with BONK.
At press time, BONK trades at $0.000027. If the price remains above the threshold, the meme coin could erase some of its recent losses.
Read More: How to Buy Solana Meme Coins: A Step-By-Step Guide
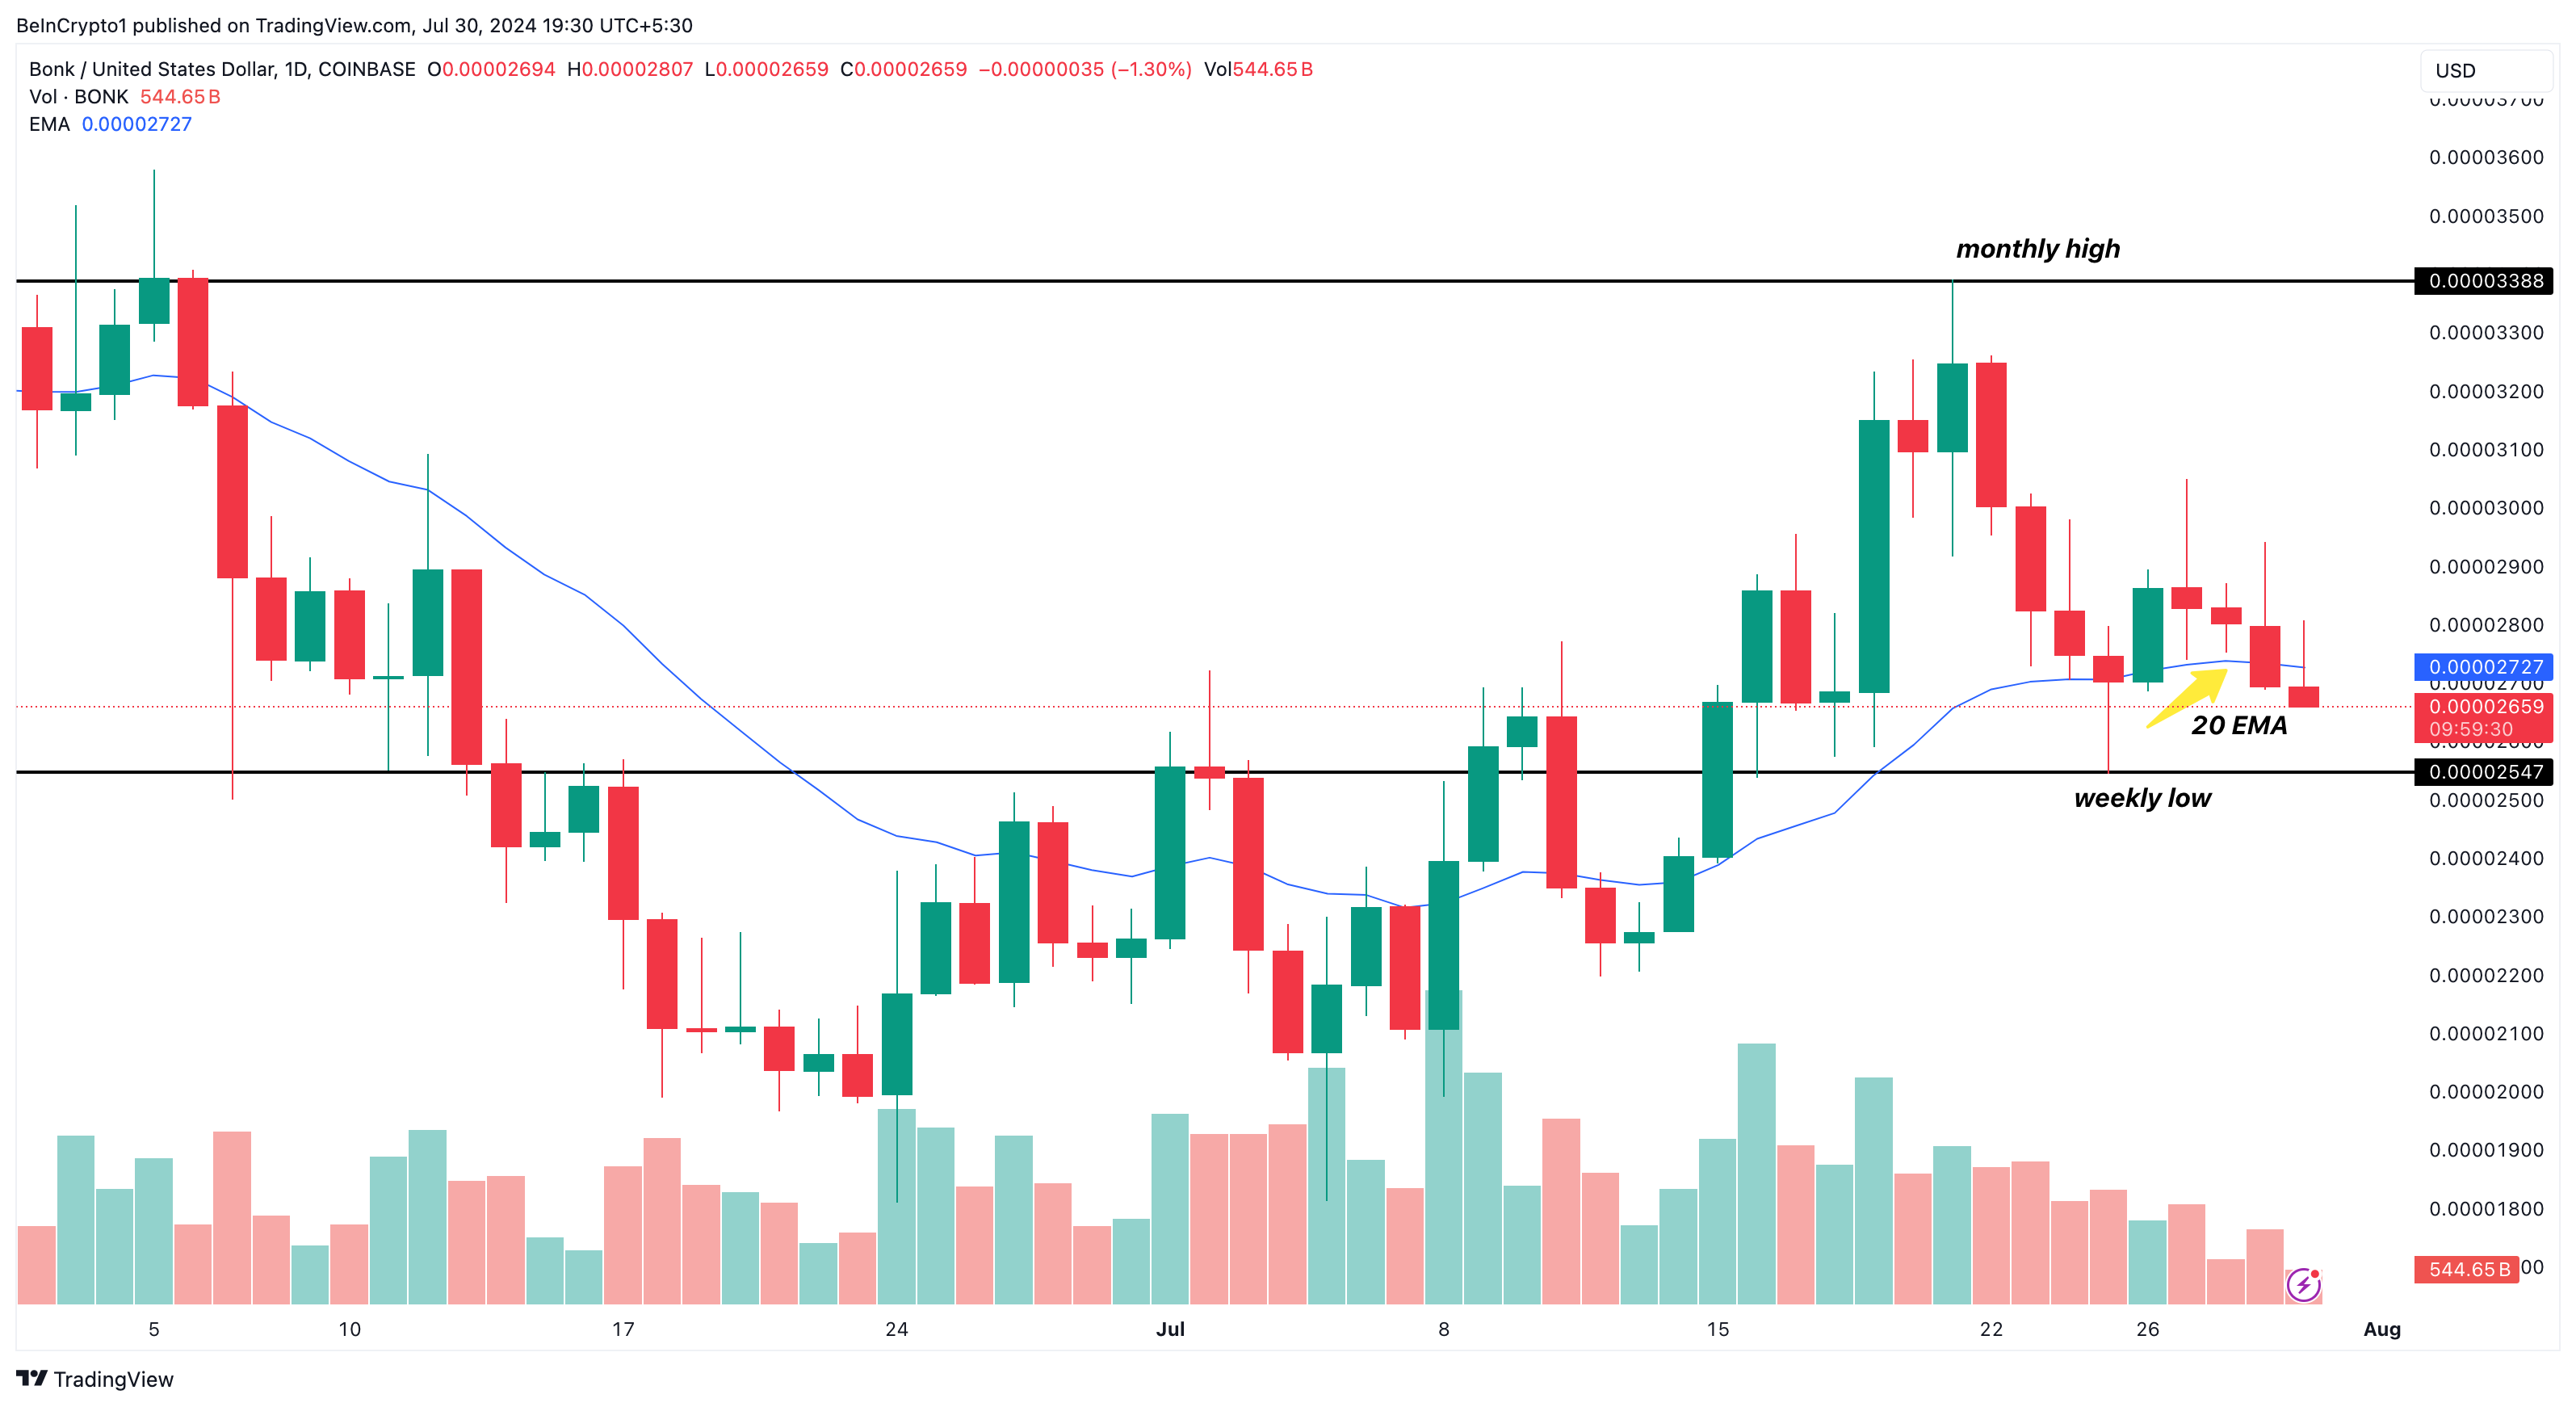 BONK Daily Analysis. Source: TradingView
 But for that to happen, buying pressure has to come in. While that is currently lacking, volatility around Bonk is improving.
In the crypto market, price movements are largely pronounced—hence, the reason the ecosystem is referred to as extremely volatile. If volatility increases, the price of a cryptocurrency can experience significant fluctuations in a rapid manner.
However, this depends on whether there is a good level of buying pressure. If selling pressure is dominant, high volatility can cause the price to decrease quickly. But if buying pressure has supreme control, prices can rise quickly.
Conversely, low volatility mostly causes sideways movement. For BONK, data from Santiment shows that volatility is increasing, indicating that the meme coin could experience notable price swings in the short term.
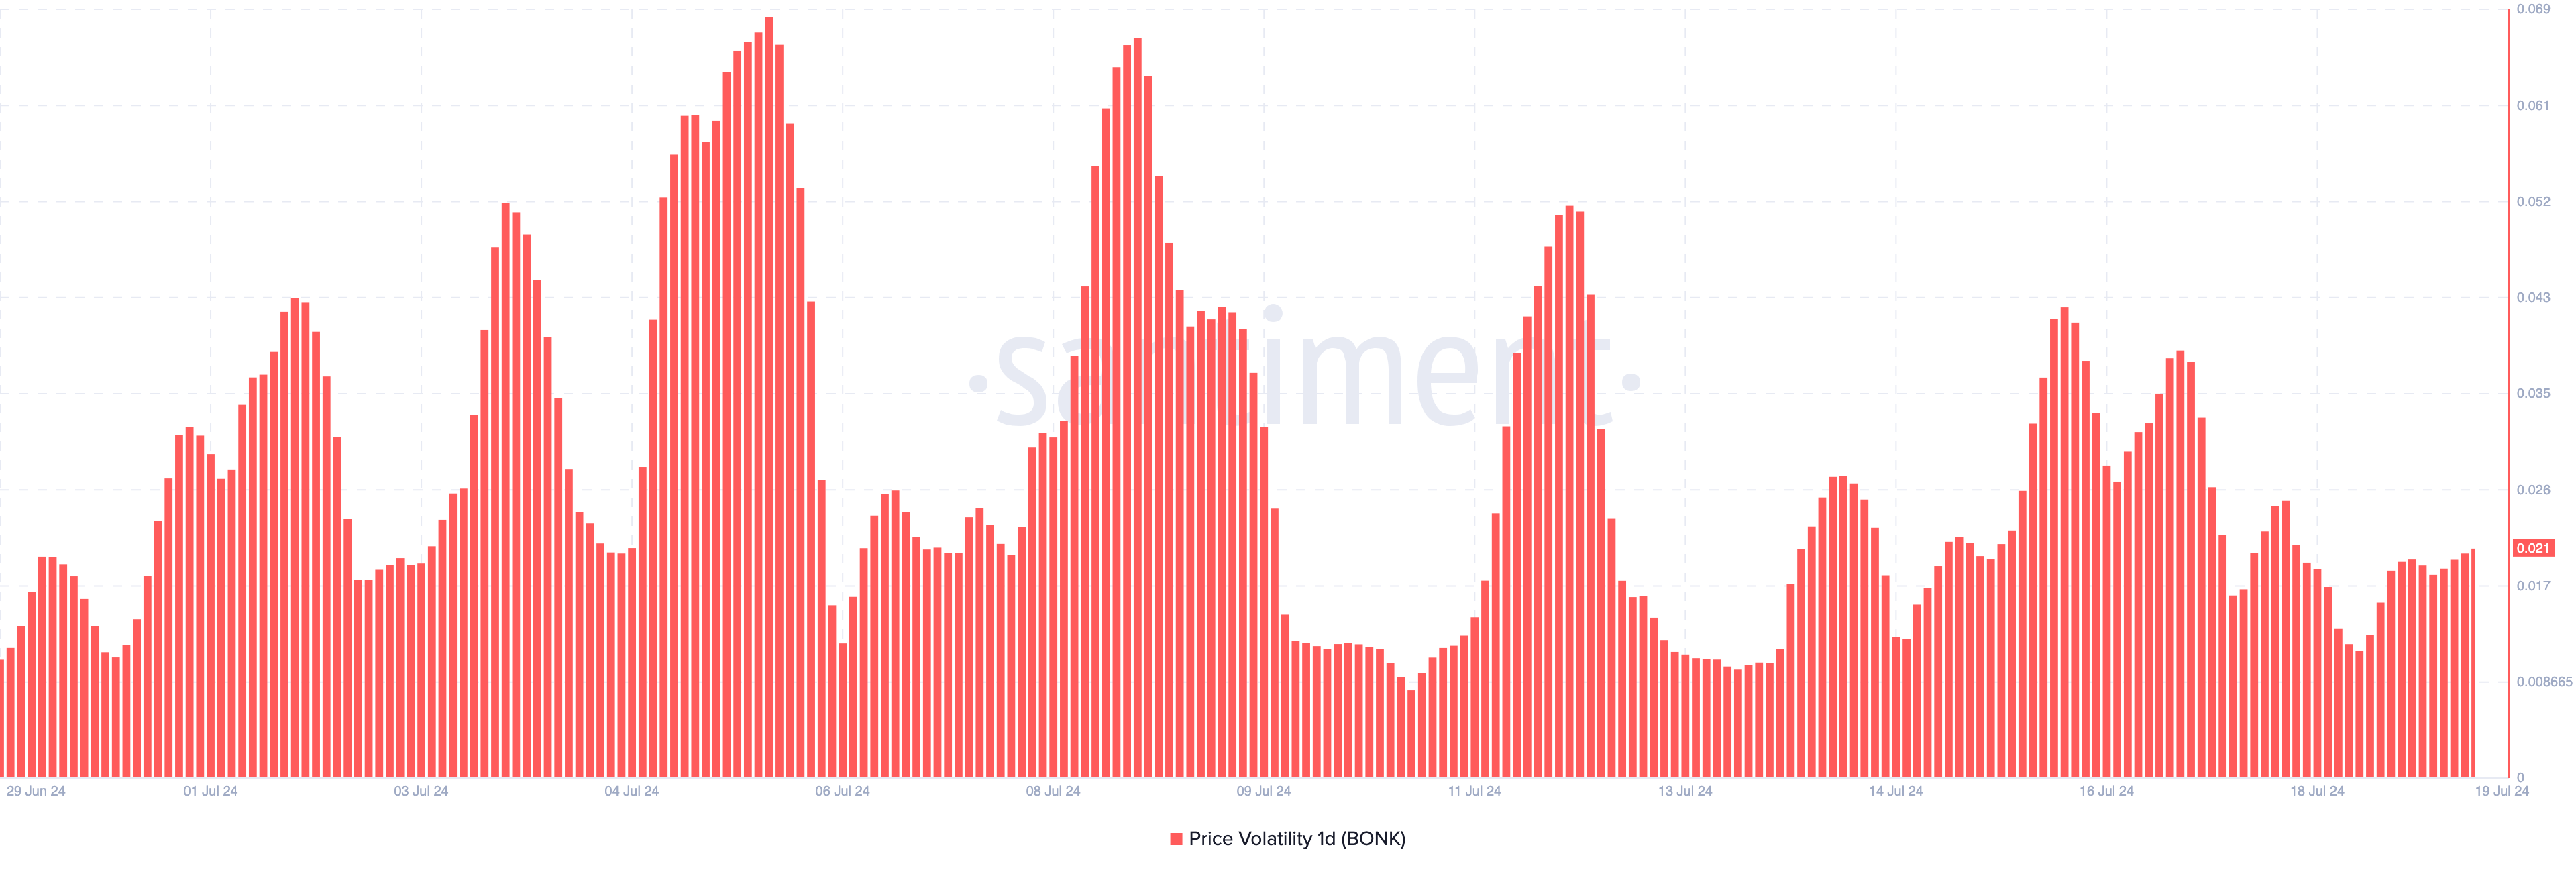 Bonk Volatility. Source: Santiment
 BONK Price Prediction: Meme Coin Plans Return to Recent Highs
As of this writing, BONK is above the 61.8% Fibonacci retracement level. The Fibonacci indicator shows the benchmarks for prices to rise to levels where it is likely to reverse.
Surpassing the 61.8% Fib level, also known as the golden ratio, gives credence to BONK’s attempt to rebound. This is also validated by the Awesome Oscillator (AO), which shows declining red bars, indicating that the downward momentum is weakening.
Furthermore, the fact the AO reading remains positive indicates that bullish momentum could soon return. Once this happens, BONK’s price may return to $0.000030.
Read More: Best Upcoming Airdrops in 2024
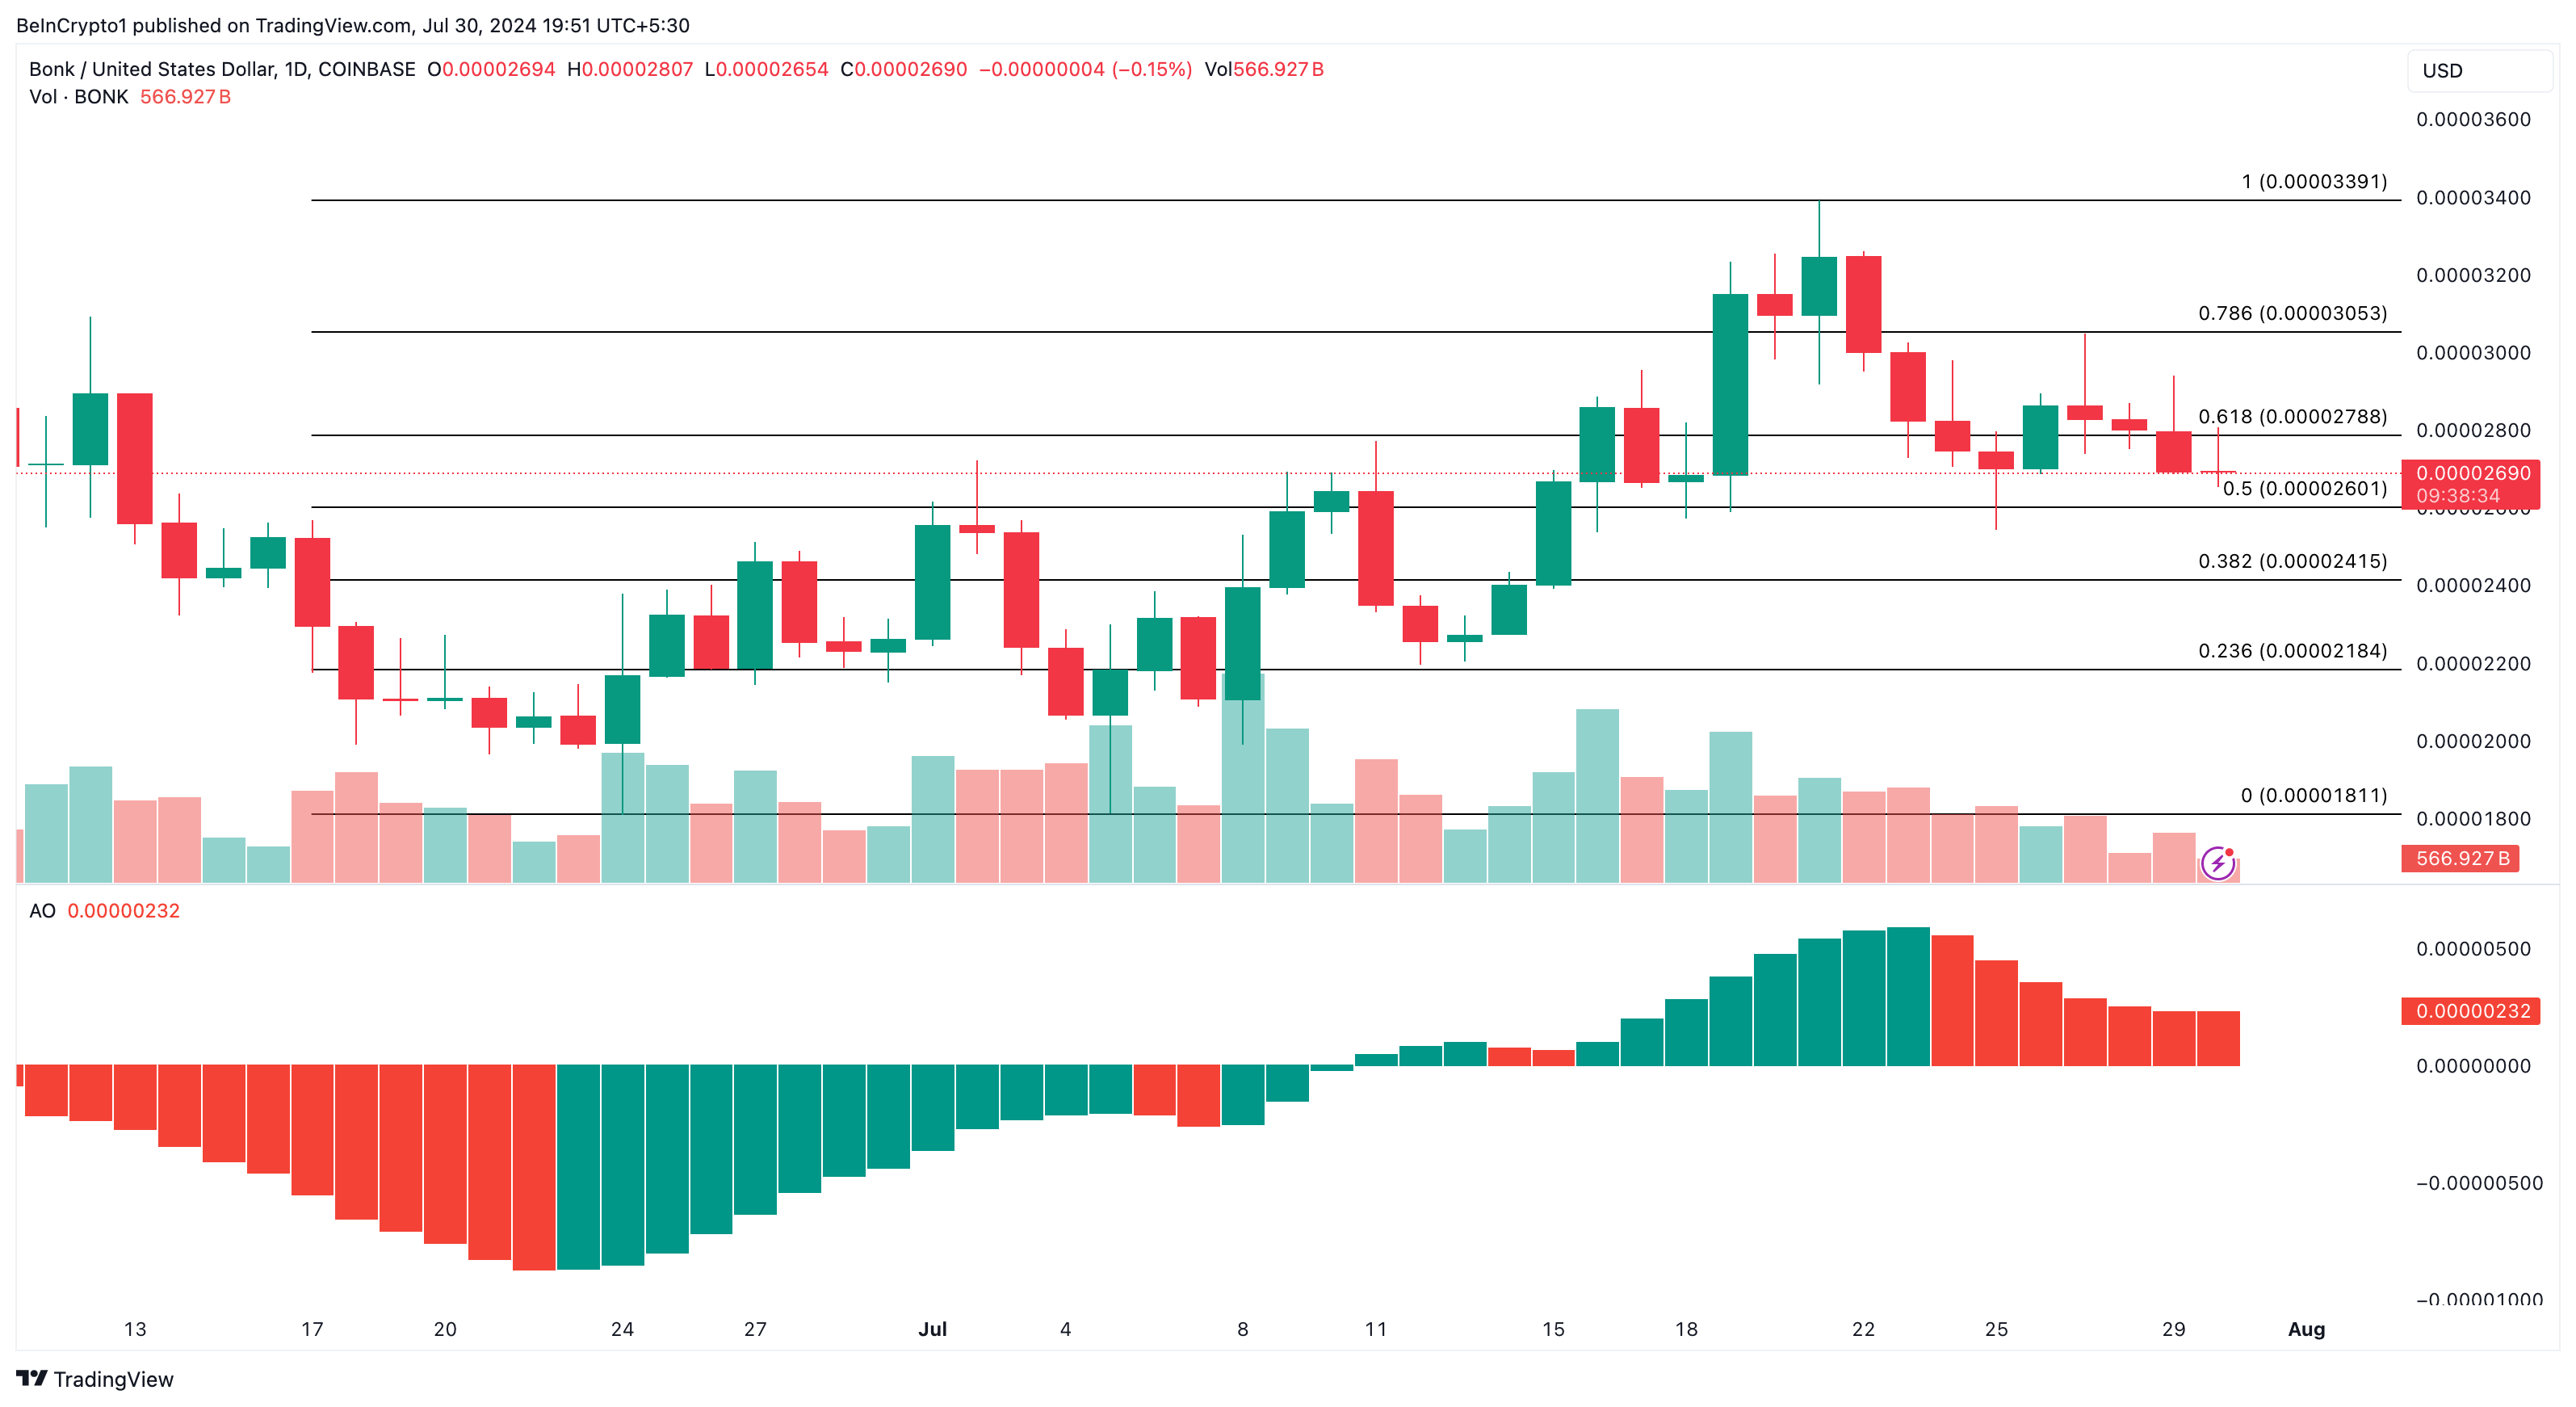 Bonk Daily Analysis. Source: TradingView
 On the downside, if bears force a rejection, BONK could drop to $0.000026 or as low as $0.000024.