
Ethereum (ETH) Experiences Selling Surge: Price Consequences
Today, July 30, marks a week since the spot Ethereum ETFs started trading. But contrary to initial anticipation, the launch of the financial products has not affected the price of ETH positively.
While the cryptocurrency’s market value rose above $3,500 on launch day, it did not take long before it dropped. Ever since, ETH has faced a notable downturn and has been swinging sideways in recent times.
Ethereum Experiences High Selling Volume and Outflows
As of this writing, ETH trades at $3,334 with hopes that the price will be higher. However, according to the Taker Buy Sell Ratio — an on-chain metric provided by CryptoQuant, that may not happen soon.
The Taker Buy Sell Ratio shows if buying is dominant in the market high or if bearish sentiment is dominant and intense selling is present. Buying pressure is dominant when the value is above 1, but it implies otherwise when the ratio is below 1.
According to CryptoQuant, Ethereum’s Taker Buy Sell Ratio is 0.96, indicating that the sell volume in perpetual swap trades is higher than the buy volume.
Read More: How to Invest in Ethereum ETFs?
 Ethereum Taker Buy Sell Ratio. Source: CryptoQuant
 If this continues, ETH’s price could decline below $3,300. Another factor suggesting a price decline for the cryptocurrency is the weekly crypto inflows.
On June 29, CoinShares reported that Ethereum had more net outflows than inflows last week. Specifically, it was about $285 million in outflows. Even though trading volume rose by a staggering 542%, Grayscale’s impact was largely responsible for the hike in outflows.
“This week saw continued outflows from Grayscale’s incumbent trust of US$1.5bn as some investors cash out, leading to a net outflow of US$285m last week.” The report stated.
At press time, the Ethereum ETF flows had not changed much, as the product recorded an outflow of $98.28 million on Monday.
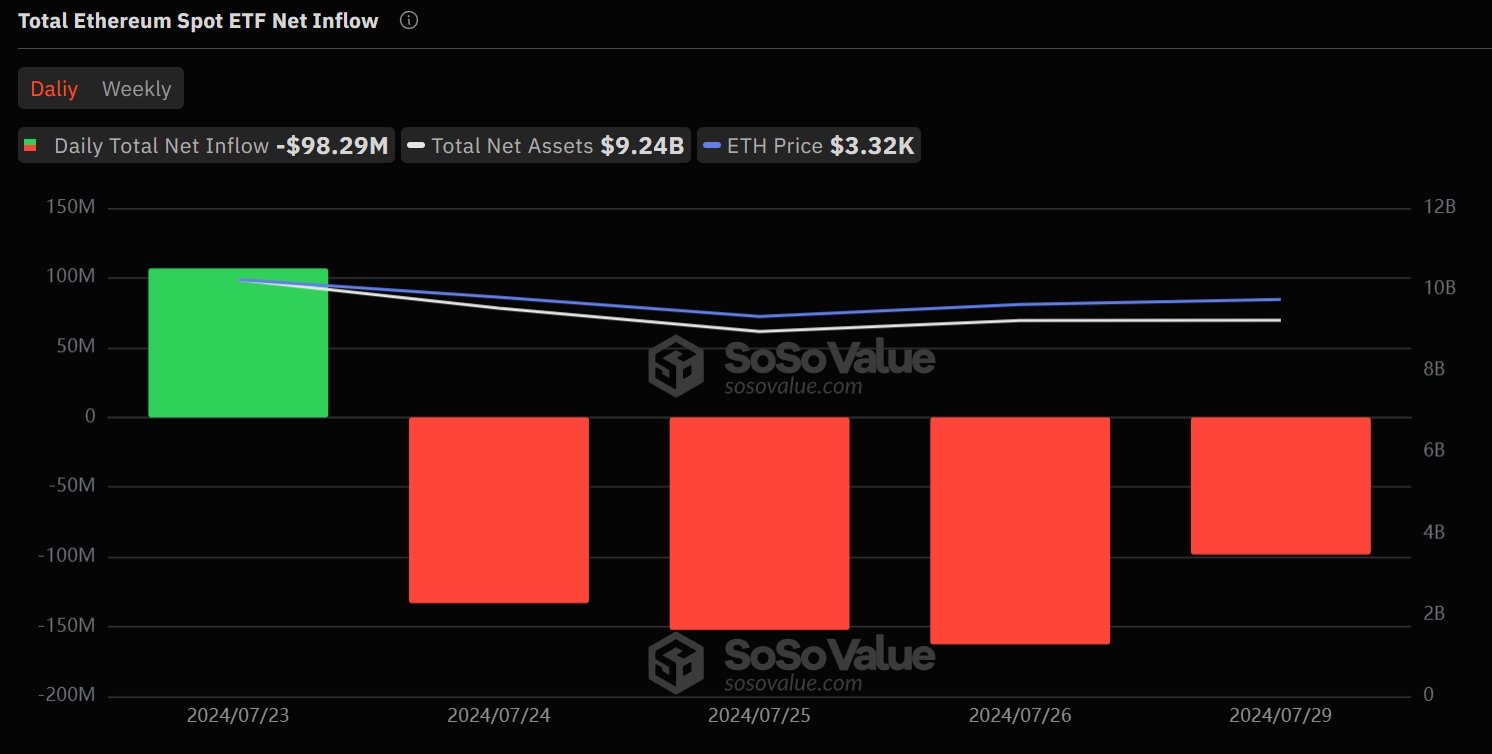 Spot Ethereum ETF Netflows. Source: SosoValue
 ETH Price Prediction: Bulls Look Set to Stop Bearish Control
According to the daily chart, ETH seems ready to ride against the selling wave. This is because the price of the altcoin is close to breaking the descending trendlines on the daily chart. If this happens, the value of ETH could reach $3,392 and subsequently attempt to reach $3,529.
This prediction is also supported by the Relative Strength Index (RSI). The RSI measures momentum, and when it rises above 50.00, it implies that bullish momentum is building up, which is what is happening with ETH.
Read More: Ethereum (ETH) Price Prediction 2024/2025/2030
 Ethereum Daily Analysis. Source: TradingView
 Should the RSI reading continue to climb, then Ethereum’s price may follow in the upward direction. However, if selling pressure in the market continues to intensify, this forecast may be invalidated. If that is the case, ETH’s price may fall to $3,255.