Chainlink (LINK) Realized Gains Spike as Token Breaks Out of Falling Wedge
Chainlink’s (LINK) recent price increase has provided fascinating insights into the behaviors of its holders. While some were quick to capitalize on the jump, others were not so lucky.
Regardless of the action, on-chain analysis shows that LINK reached a spot it has not hit in months. It also hints at a crucial move for the token’s price.
Chainlink Holders Hop on Profits, Lose Afterwards
On Sunday, July 21, Chainlink’s price reached $15 for the first time in more than 30 days. Following the rise, data from Santiment reveals that the Network’s Realized Profit/Loss jumped to 106.55 million.
Network Realized Profit/Loss shows if traders are selling at a loss or realizing gains. A spike in the positive region to 106.88 million, as it was with LINK, shows that many holders booked profits due to the increase.
However, the increase in selling pressure led the price back down as it traded at $14.36 at press time. As such, some holders were late to the party, and as of this writing, the Network Realized Profit/Loss is at -13,000, meaning that realized losses are now dominant.
Read More: What Is Chainlink (LINK)?
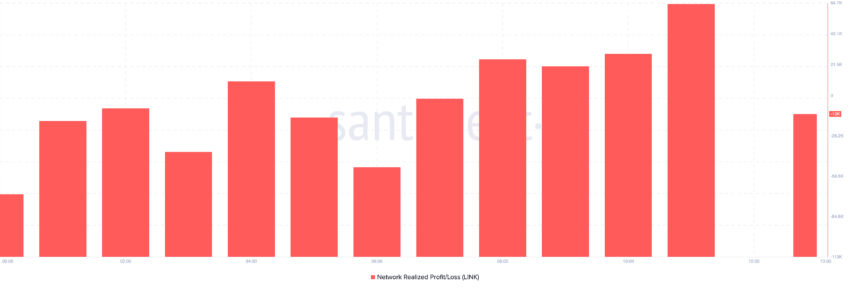 Chainlink Network Realized Profit/Loss. Source: Santiment
 The decline in realized profits could be a good sign for LINK’s price. This is because selling pressure has reduced, and the price could stabilize or go on another uptrend.
The surge in new and active addresses on the network also supports the potential increase. According to IntoTheBlock, both metrics had increased in the last seven days.
The hike implies that a new set of market participants are adopting LINK and adding the token to their portfolio.
Likewise, it means that users are continually interacting with the Chainlink network. Further, as long as this continues or improves, LINK’s potential to trade higher will increase.
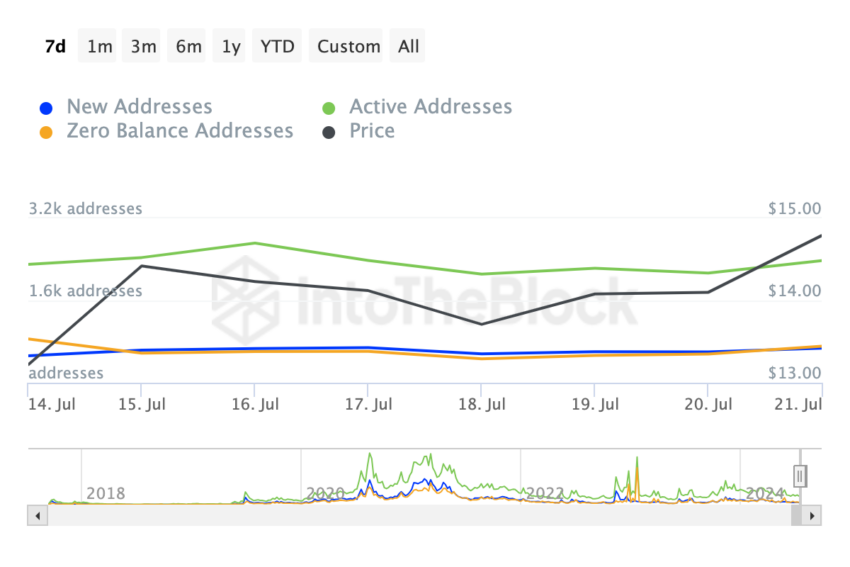 Chainlink New and Active Addresses. Source: IntoTheBlock
 However, understanding that price movement is not limited to on-chain activity and that the technical state also has a role to play gives more credence to the prediction.
LINK Price Prediction: Next Target Revealed
From a technical point of view, LINK’s price was able to jump after it broke out of a falling wedge. In non-technical terms, a falling wedge is a pattern formed by two descending trendlines.
The trendline at the top represents the Lower Highs (LH), indicating that the price peak is dwindling. On the other hand, the trendline at the bottom (LL) represents the Lower Lows (LL).
Because the trendlines descend, the falling wedge is falsely considered to be a bearish pattern. However, that is not the case. This is because selling pressure decreases as the price falls. Hence, it brings about a reversal and break beyond the upper resistance.
From the chart below, LINK has been able to break the $14.15 resistance. After a slight retracement, there has been a strong buy signal.
Read More: Chainlink (LINK) Price Prediction 2024/2025/2030
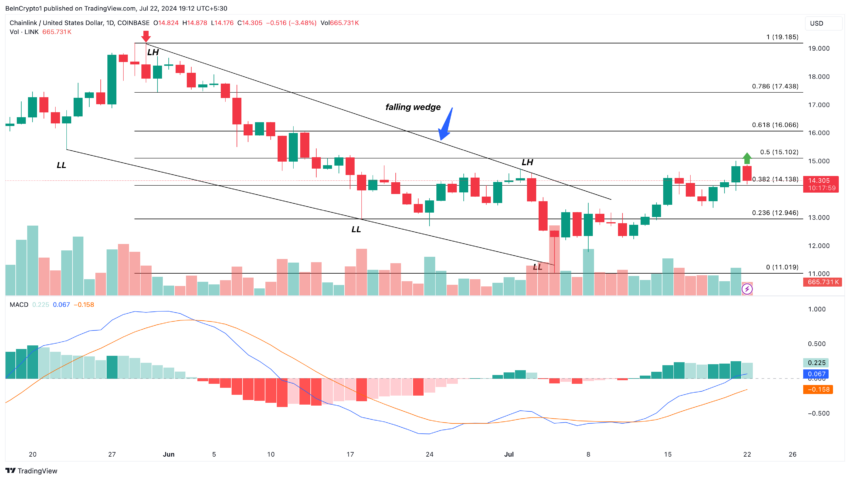 Chainlink Daily Analysis. Source: TradingView
 This is also backed by the positive Moving Average Convergence Divergence (MACD). The MACD’s positive reading implies that momentum is positive. If this remains the case, Chainlink could hit $15.10 first before it attempts to test $16.06.
However, LINK’s price may be unable to reach these targets if holders continue to realize losses. If this happens, the crypto’s next move could be a drop to $14.13.

