CryptoQuant’s Bitcoin Chart Decoded: Unlocking the Secrets of Market Timing

- CryptoQuant analysis identifies potential buying opportunities during Bitcoin dips.
- A Bitcoin whale signals bullish sentiment with a substantial options bet.
- Dollar-cost averaging can help investors navigate Bitcoin’s volatility.
CryptoQuant’s latest analysis sheds light on Bitcoin’s price drawdowns from April 2023 to July 2024, highlighting key periods of decline and potential recovery phases that could offer buying opportunities for investors.
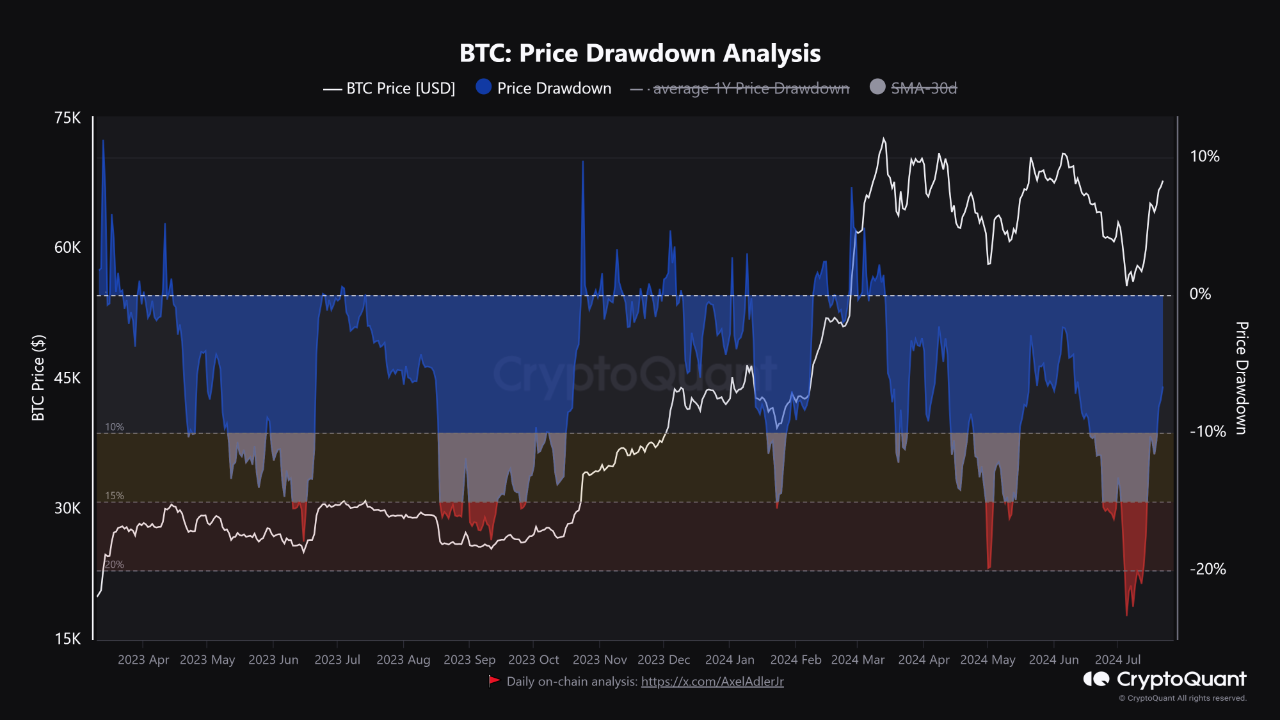
Source: CryptoQuant
The chart shared by CryptoQuant illustrates several instances where Bitcoin’s price experienced significant drawdowns, particularly from mid-April 2023 to July 2024. The white line marks BTC’s price in USD, and the blue and red areas signify price drawdowns. Key thresholds for drawdowns (-10%, -15%, -20%) are also highlighted.
After each major drawdown, the chart depicts recovery phases where the price bounced back. This cyclical behavior is crucial for investors to consider, as it provides key insights into strategic investment during market corrections.
CryptoQuant’s analysis suggests that the red-shaded areas, representing 15-20% corrections, can be viewed as strategic buying oppo…
The post CryptoQuant’s Bitcoin Chart Decoded: Unlocking the Secrets of Market Timing appeared first on Coin Edition.