Chainlink (LINK) Network-Wide Accumulation Leads to 10% Jump in 7 Days
LINK, the native token that powers leading oracle network Chainlink, has witnessed a surge in demand amid the broader market recovery in the past two weeks.
The asset’s price has surged by 10% in the past seven days and continues to enjoy the attention of whales who keep adding LINK tokens to their holdings.
Chainlink Whales Pay Attention to Buy Signals
LINK’s exchange netflows have been negative since July 4. Since then, over $110 million worth of LINK tokens have been withdrawn from exchanges.
An asset’s exchange netflows measure the difference between the amount of a cryptocurrency moving into and out of exchanges. When a negative netflow is recorded, more tokens/coins are withdrawn from exchanges than deposited. This is a bullish signal that suggests less selling activity.
Conversely, a positive exchange netflow indicates that more tokens/coins are deposited into exchanges than withdrawn. This signals that investors are preparing to sell, potentially leading to an asset’s value decline.
Read More: How To Buy Chainlink (LINK) and Everything You Need To Know
 Chainlink Exchange Netflows. Source: IntoTheBlock
 As of July 16, LINK tokens worth $8 million were withdrawn from exchanges, according to IntoTheBlock’s data.
During the two weeks in review, LINK whales have ramped up their accumulation efforts. In a recent post on X, on-chain sleuth Lookonchain revealed that an unidentified whale or institutional investor has accumulated LINK since June 24.
93 new wallets have collectively withdrawn 12.75 million LINK tokens, valued at approximately $167 million, from the leading exchange Binance.
Negative MVRV Ratios Prompt LINK Whale Accumulation
Also, crypto analyst Ali Martinez, in a post on X, found that LINK whales that hold between 100,000 and 1,000,000 tokens have collectively “bought up over 10 million $LINK in the last two weeks, totaling approximately $120 million.”
 Chainlink Supply Distribution. Source: X
 LINK whales have bought more tokens recently because the asset is undervalued. This can be gleaned from its market value to realized value (MVRV) ratios over various moving averages.
For example, LINK’s MVRV ratios for the 30-day and 90-day moving averages are -4.43% and -10.85%, respectively.
 Chainlink Market Value to Realized Value Ratios. Source: Santiment
 This metric measures the ratio between an asset’s current price and the average price at which all its coins or tokens were acquired.
When its value is below zero, it suggests that the asset’s market value is less than the average purchase price of all its tokens in circulation. When this happens, the asset is said to be undervalued.
Historically, negative MVRV ratios offer a buying opportunity because the asset is deemed to trade below its cost basis. Therefore, traders can buy at a lower price and hope to sell higher.
LINK Price Prediction: Risk of Shedding Recent Gains
Although LINK’s value has surged by double digits in the past week, its Chaikin Money Flow (CMF) remains trapped below the zero line and continues its downtrend.
This indicator measures how money flows into and out of an asset. A bearish divergence is formed when an asset’s price rises while its CMF declines.
This divergence suggests that enough buying pressure does not support the price uptick; the asset may witness a pullback.
If this happens, LINK’s value will fall below $14 to trade at $13.84.
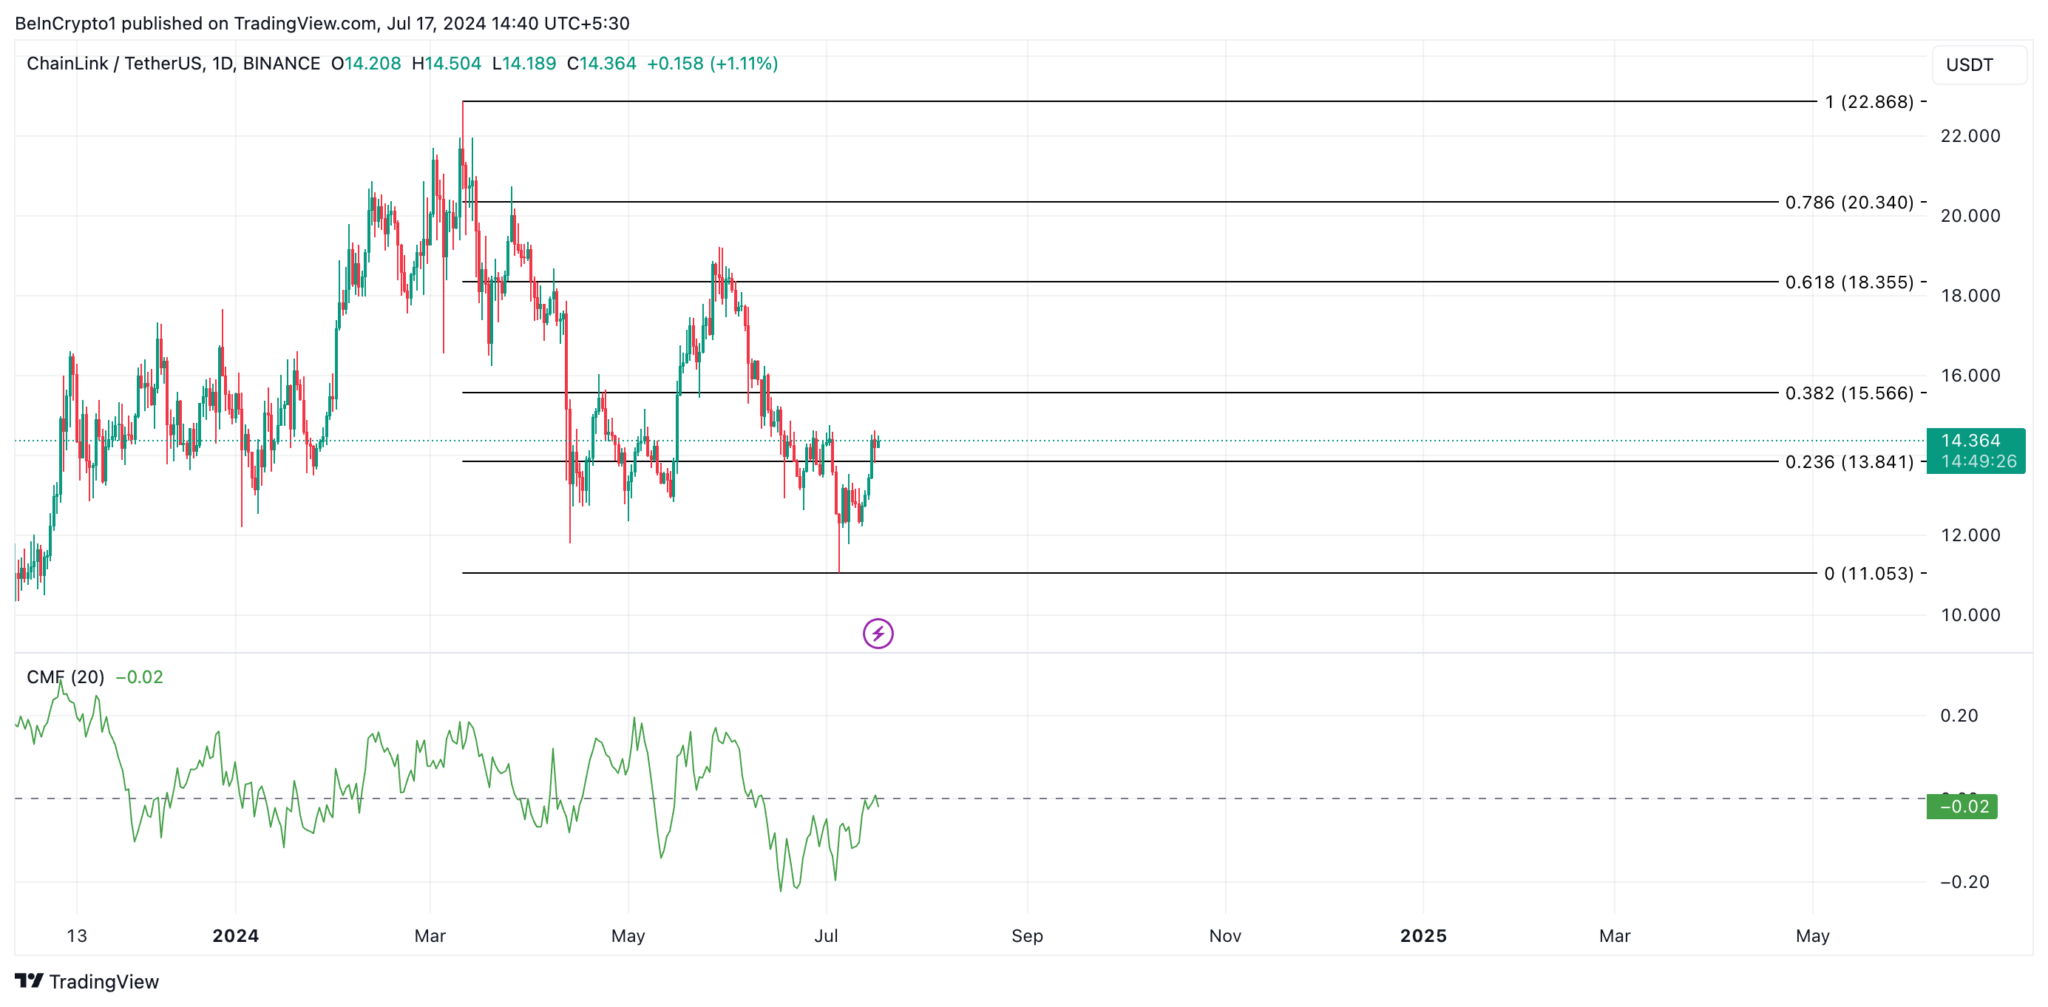 Chainlink Analysis. Source: TradingView
 However, the token may climb to $15.56 if it maintains its current uptrend.