Aptos (APT) at Risk of Price Swings as Volatility Heightens
APT, the governance token of the Layer 1 blockchain network Aptos, has witnessed a significant price decline in the last month. This comes amid the general decrease in activity in the cryptocurrency market during that period.
Exchanging hands at $5.82 at press time, the altcoin’s value has plunged by over 30%. APT remains at risk of significant price swings as its volatility markers have begun to spike.
Aptos Sees Spike in Volatility
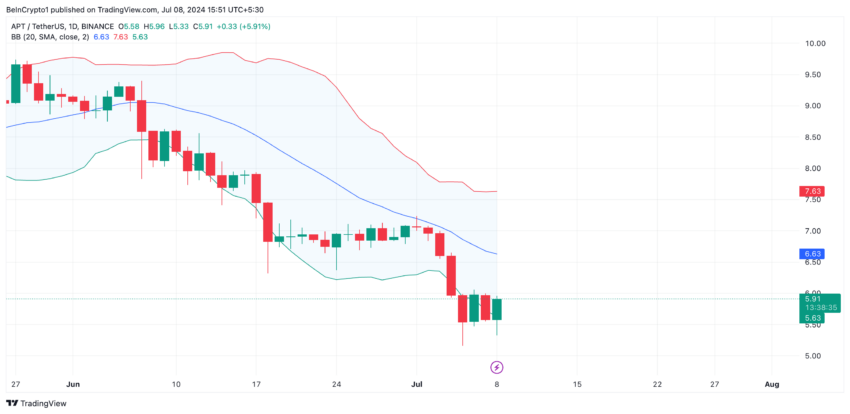
The first indicator of the heightening volatility in the Aptos market is its Bollinger Bands. Readings from this key volatility market show a widening gap between the upper and lower bands of the indicator.
 Aptos Analysis. Source: TradingView
 Bollinger Bands measure an asset’s market volatility and identify potential overbought or oversold conditions. When the gap between the upper and lower bands of the indicator widens, it indicates increased market volatility.
Also, during a period of price decline, the widening bands suggest that the downtrend may continue. It signals stronger selling pressure or a lack of buying interest at current price levels.
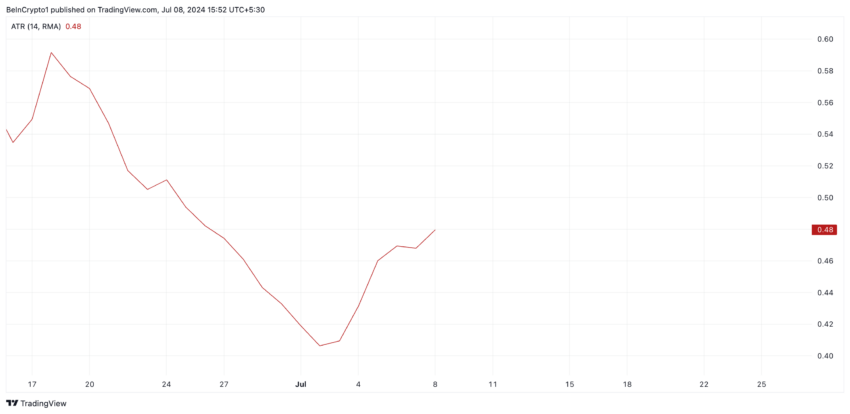
APT’s surging Average True Range (ATR) confirms the spike in market volatility.
Read More: Where To Buy Aptos (APT): 5 Best Platforms for 2024
 Aptos Analysis. Source: TradingView
 This indicator measures market volatility by calculating the average range between high and low prices over a specified number of periods.
When its value rises, it suggests increased market volatility and hints at the possibility of a price swing in either direction. At press time, APT’s ATR is 0.48. It has been on an uptrend since July 1.
APT Price Prediction: Bearish Divergence Puts Token at Risk
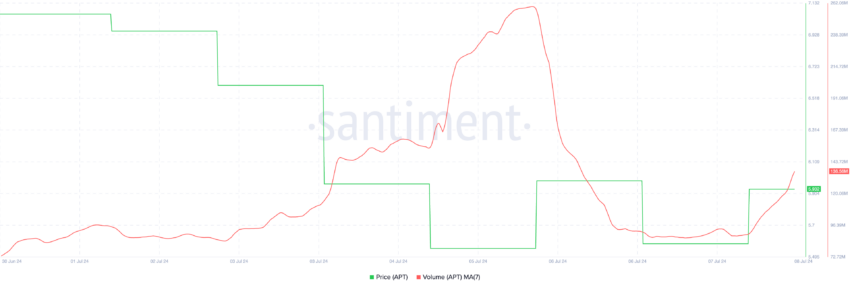
Despite APT’s price decline, it has witnessed a surge in its daily trading volume. While the token’s price has fallen by 18% in the last week, its trading volume has increased by 29% during the same period.
 Aptos Trading Volume Source: Santiment
 The opposite movements of APT’s price and its daily trading volume create a bearish divergence, suggesting that more market participants are actively selling the asset.
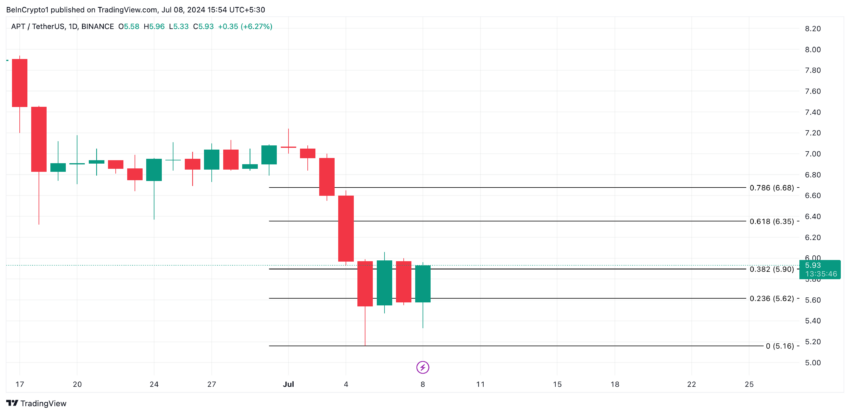
If selling activity remains high, the token’s value may plunge to $5.62.
 Aptos Analysis. Source: TradingView
 However, while increasing volume during a decline generally supports the continuation of the downtrend, extreme spikes in volume could sometimes precede a price reversal. Therefore, if APT witnesses a correction, its price may climb above $5.90.


