Dogwifhat (WIF) Loses Bulls Support, Chases New Low
A few days after leading the meme market rally, Dogwifhat (WIF) has started shedding some of its most recent gains.
Trading at $1.78 at the time of writing, the dog-themed token ranks as the seventh cryptocurrency asset with the most losses in the past 24 hours.
Dogwifhat Falls Below Support
Dogwifhat has witnessed a 13% price dip in the past 24 hours. This double-digit price decline came after a few days of rallying, which led to the formation of an ascending channel on a daily chart.
This pattern is formed when the price of an asset consistently makes higher highs and higher lows, creating two parallel trend lines that slope upwards.
The upper line of this channel forms resistance, while the lower line is regarded as support. In WIF’s case, it faced resistance at $2.62 and found support at $2.37.
Read More: How To Buy Dogwifhat (WIF) and Everything Else To Know
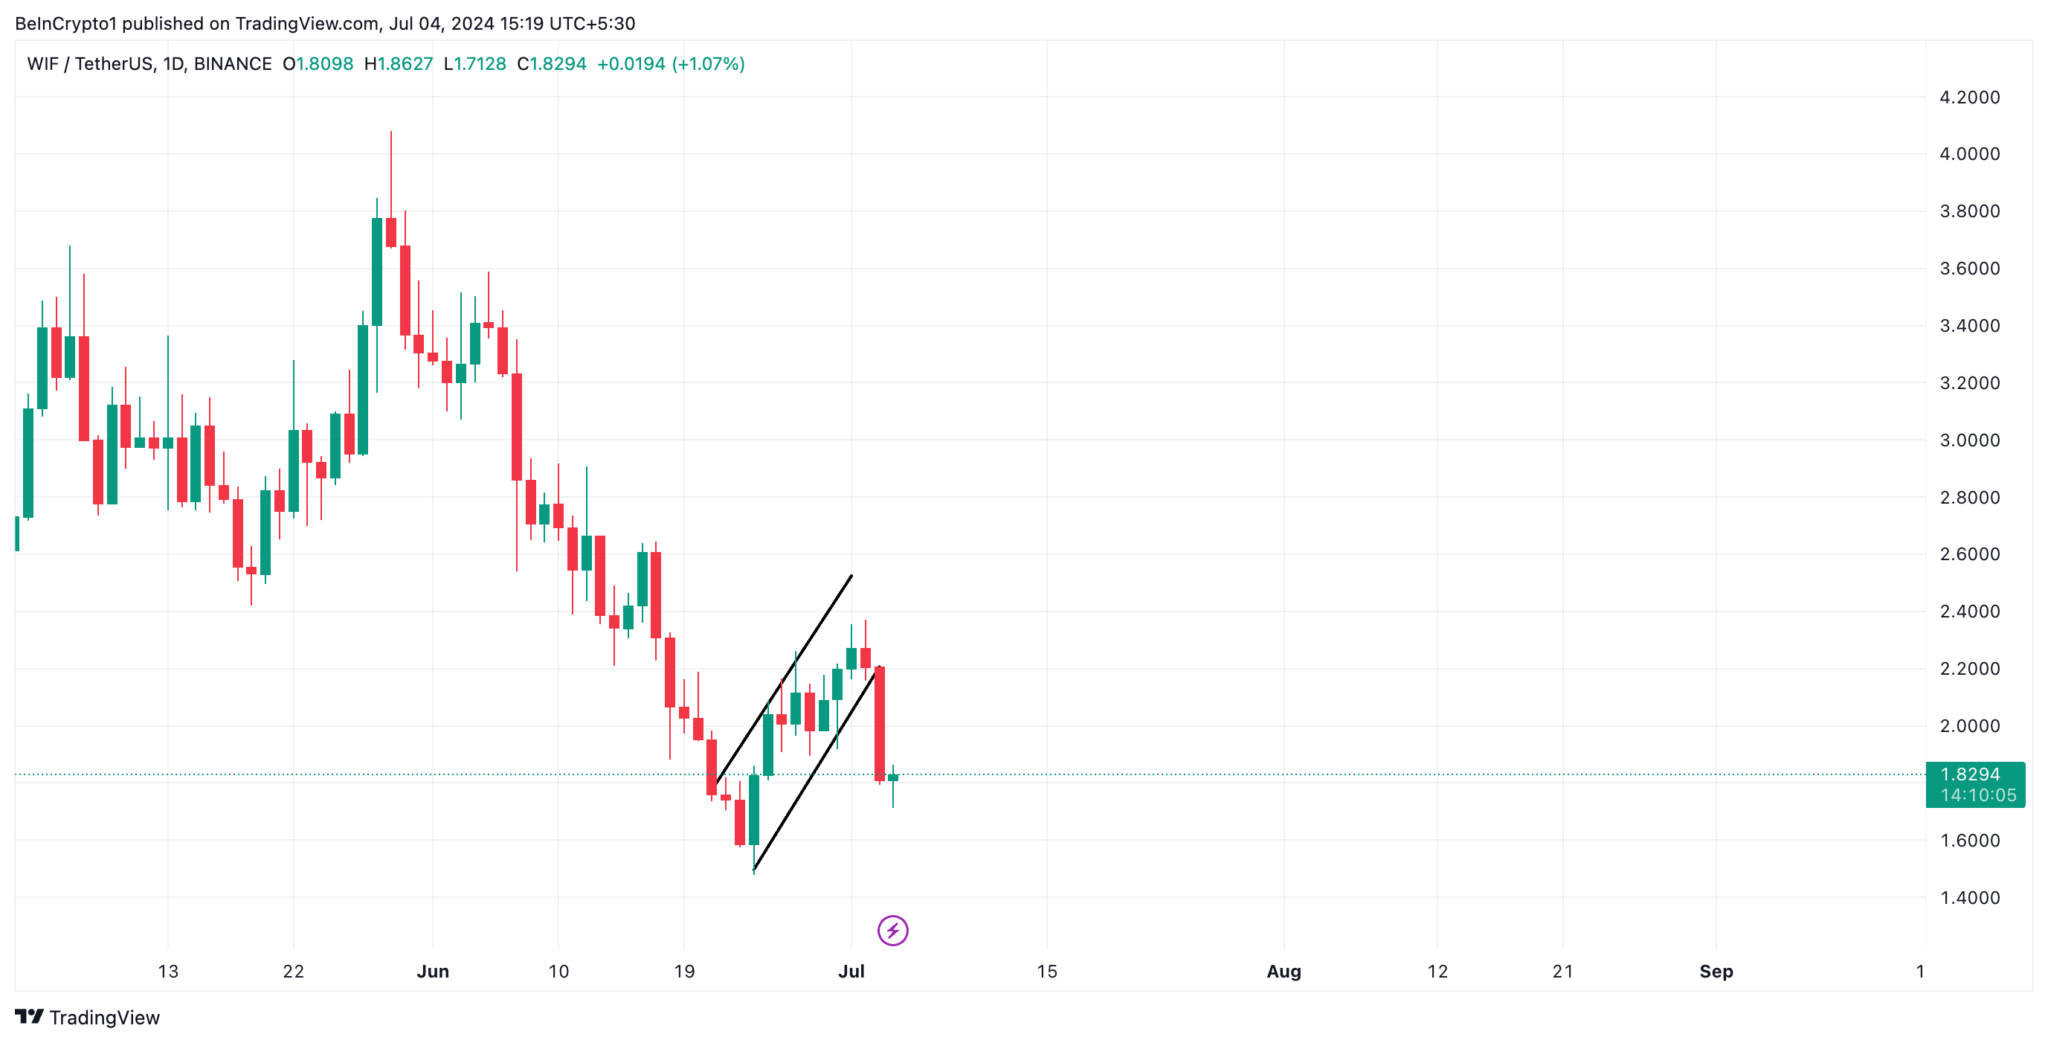 Dogwifhat Analysis. Source: TradingView
 As WIF’s buying pressure waned, its price closed below the lower trend line on July 3, signaling that the bulls failed to defend the support level.
When an asset’s price falls below support, it means that selling pressure has overwhelmed buying pressure at that level. It is seen as an indication that the price decline will continue.
Traders see the break below support as a sign of weakness, prompting them to sell more. This may lead to a further decline in WIF’s price.
Despite the decline in WIF’s price in the past 24 hours, its trading volume has spiked. Totaling $621 million at press time, it has risen by 101% during the period under review.
 Dogwifhat Trading Volume. Source: Santiment
 A bearish divergence occurs when an asset’s price dips while its trading volume surges. This suggests that many market participants are selling their holdings due to the price drop, further sustaining the downtrend.
WIF Price Prediction: The Nays Have it
Readings from WIF’s Parabolic Stop and Reverse (SAR) indicator confirm the shift in market sentiment from bearish to bullish. As of this writing, the dots of this indicator rest upon the token’s price after an eight-day period under it.
This indicator identifies an asset’s trend direction and potential reversal points. When its dots are placed above an asset’s price, the market is said to be declining. It indicates that the asset’s price has been falling and may continue.
Should this continue, WIF’s price may drop to $1.71.
Read More: 5 Best Dogwifhat (WIF) Wallets to Consider In 2024
 Dogwifhat Analysis. Source: TradingView
 However, if buying momentum returns to the market, the meme coin’s value may rise to $1.86.