
Market in wait-and-see mode as Bitcoin volumes stagnate
Tracking and analyzing transfer volumes is crucial for understanding the underlying economic activity within the Bitcoin network. Spikes in transfer volumes show heightened market participation, either from new entrants and institutional investors — usually during bull runs — or significant transactions by existing participants — usually during downturns.
While spikes in transfer volumes usually come after major price movements and aren’t good predictive tools for price action, they can still be used to infer the levels of liquidity and potential future volatility in the market.
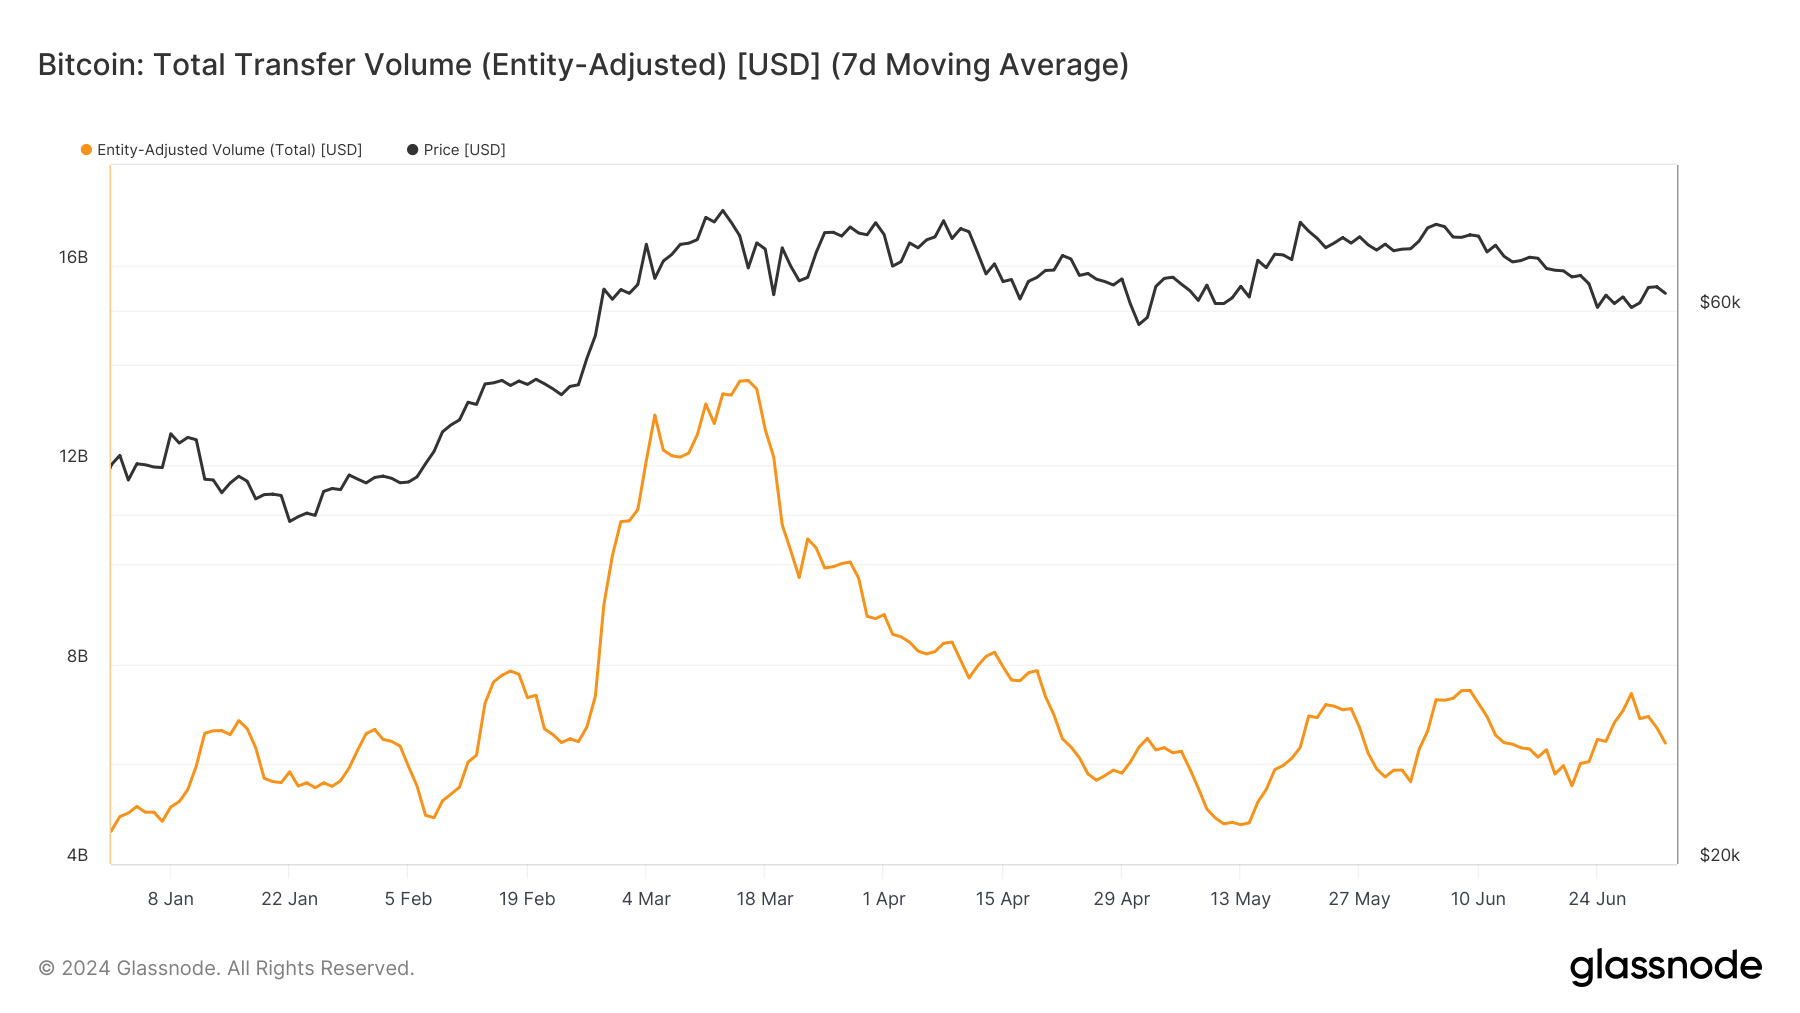
Glassnode’s entity-adjusted transfer volume shows the actual economic activity on the Bitcoin network by measuring the USD value of coins moved between entities. This metric is particularly useful as it filters out internal transactions within entities like exchanges, providing a clearer picture of genuine market movements.
The total transfer volume on the Bitcoin network reached its all-time high of $13.67 billion on March 15. The ATH was reached just two days after Bitcoin established its own high of $73,104 on March 13. This shows that a significant amount of BTC was transferred between entities at the height of market euphoria.
However, the market failed to reach anywhere near that high since mid-March, struggling to surpass $7.5 billion since April 20. The reduction in volume shows a cooling off from the peak market activity, which comes as Bitcoin’s price consolidates and it struggles to break away from its sideways trading pattern.
The relatively stable transfer volume we’ve seen over the past month or so shows a market in a wait-and-see mode, where neither strong bullish nor bearish currents dominate the volume. Bitcoin has remained bound in a range, fluctuating between $60,000 and $65,000, seeing upward movements only on big regulatory or broader market movements.
The stagnation in market activity can also be seen through Bitcoin’s spot trading volume. While both are essential, the total transfer and spot volumes provide slightly different insights into the market. Spot volume represents the cumulative trading volume on exchanges, reflecting the trading activity against USD-backed currencies, including both fiat and stablecoins.
This is why spot volume is more indicative of the immediate trading behavior and market liquidity on centralized exchanges rather than the broader market. While transfer volumes give a sense of the overall movement of value across the network, spot volumes show trading patterns and investor sentiment in the shorter term.
Historically, spot volumes tend to peak slightly later than transfer volumes, as evidenced by the data showing a dip in spot volume to $10.465 on March 13 despite Bitcoin hitting its ATH. The yearly high for spot volume was reached on March 20 at $14.156 billion, demonstrating the lag between price and trading volume peaks.
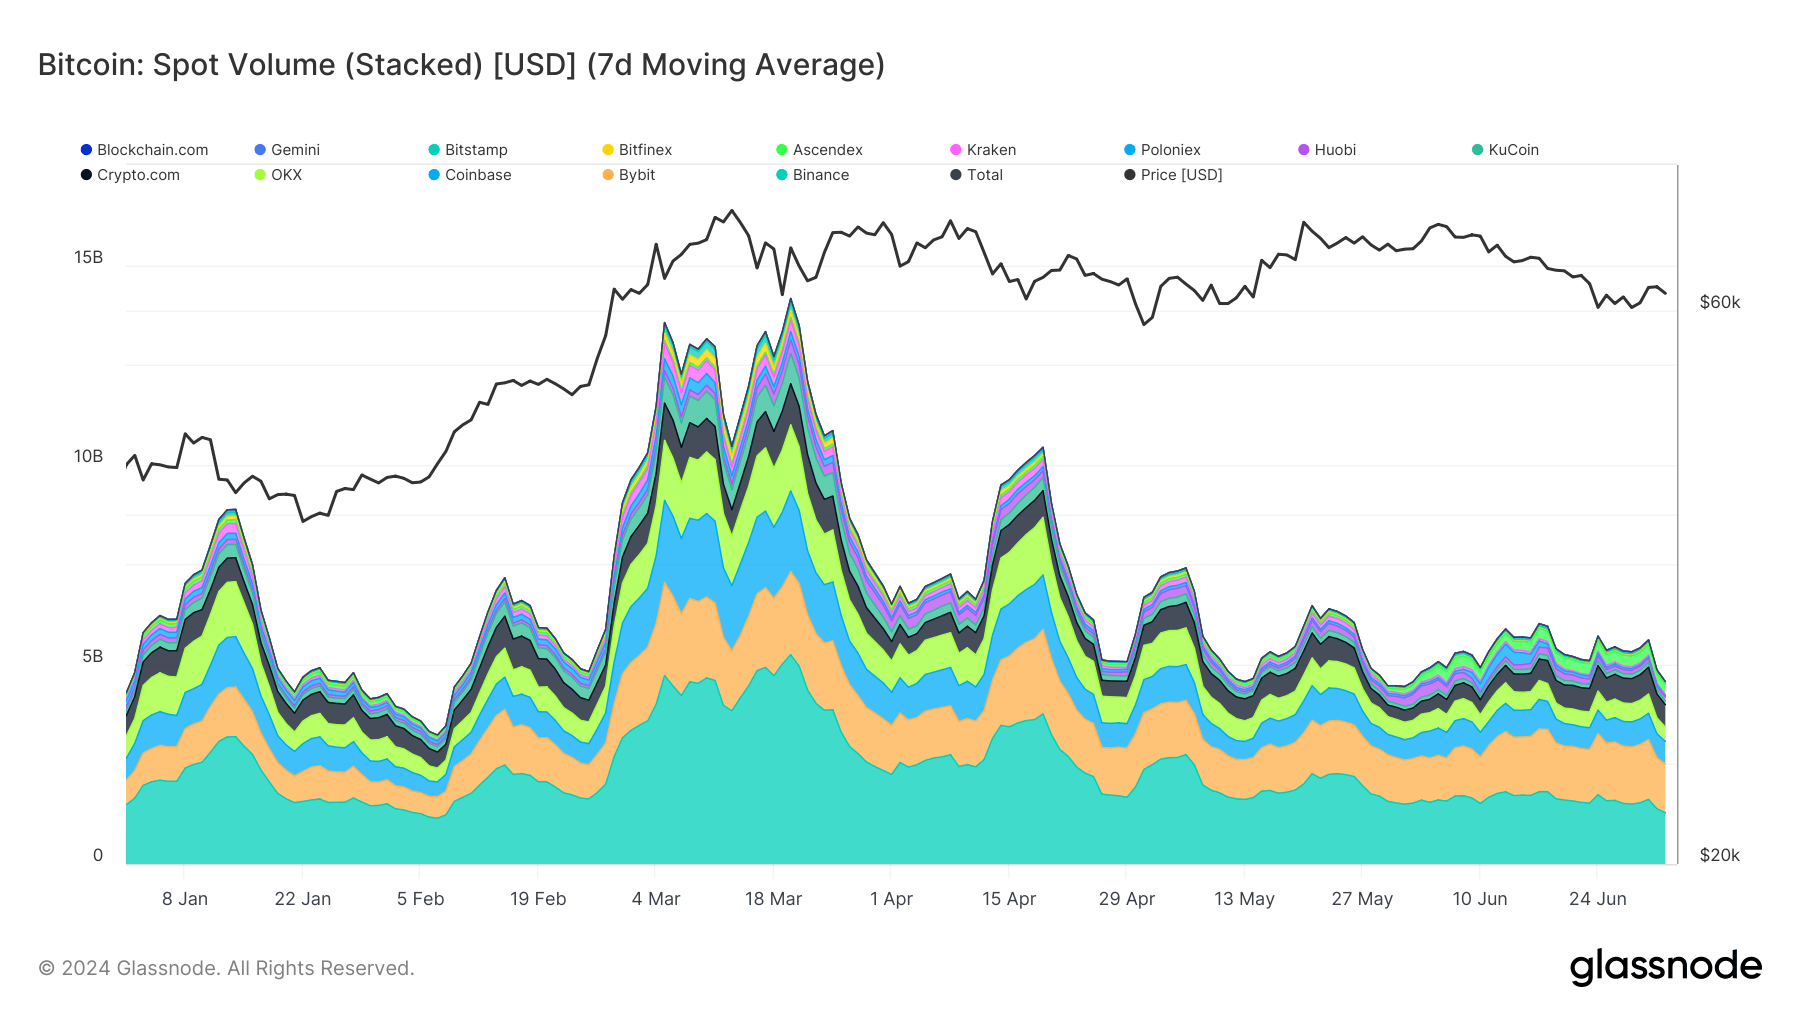
Unlike transfer volumes, spot volumes tend to peak in response to sharp price drops, not just upward movement, as traders react to mitigate losses. During periods of price stability, spot volumes tend to decline. This phenomenon has been particularly evident over the past two months, where spot volumes have remained below $6 billion, mirroring the lack of substantial activity in transfer volumes.
The data shows a distinct trend: market participants become less active as Bitcoin’s price stabilizes within a certain range. This pattern has become more apparent in the past few weeks, where Bitcoin has traded between $60,000 and $65,000, leading to diminished trading volumes. Despite stable prices, the drop in spot volumes by over $1 billion since the beginning of July shows the market is still reluctant to engage heavily without clear directional movements.
The market is currently in consolidation, where participants are waiting for new fundamental drivers or external factors to make their next move. Previous CryptoSlate analysis identified similar trends through other metrics — all pointing to a tense market that refuses to move without significant outside factors.
If Bitcoin remains within its current range, we can expect low trading volumes. However, any regulatory, political, or macroeconomic developments could turn into a spark that ignites the market and breaks this pattern.
The post Market in wait-and-see mode as Bitcoin volumes stagnate appeared first on CryptoSlate.