Bitcoin price trends post-halving: Historical data points to cyclical surges
Onchain Highlights
DEFINITION: Analysis of Bitcoin’s price performance across all epochs following each halving event.
Bitcoin’s price performance following each halving reflects notable trends in the market. The chart illustrates the price trajectories across five epochs, beginning with the 2012 halving, when the block reward was cut down from 50 BTC to 25 BTC — to the most recent halving in April 2024, which reduced the block reward to 3.125 BTC.
Historically, post-halving periods have seen substantial increases in Bitcoin’s price. For instance, after the 2012 halving, Bitcoin’s price surged exponentially, establishing a pattern of pronounced growth. The 2016 and 2020 halvings continued this trend, though with varying magnitudes and volatility.
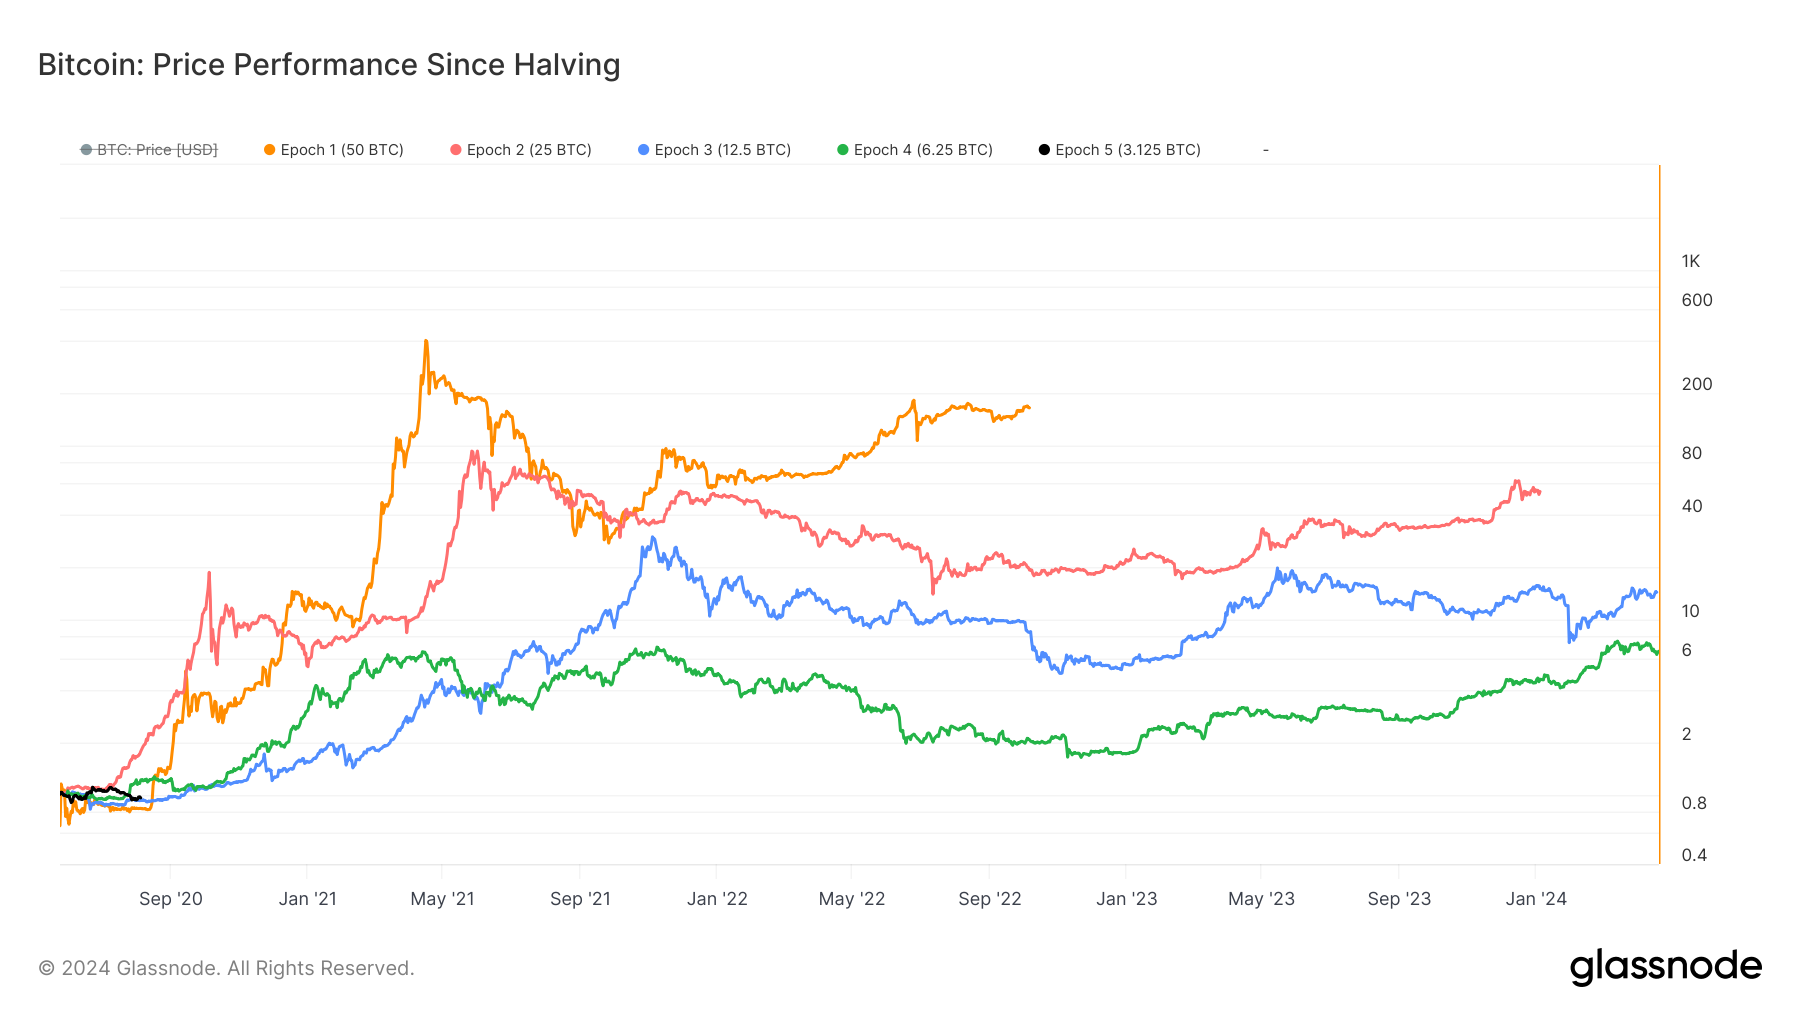
The data shows that the post-halving periods tend to trigger a rapid price increase, followed by periods of consolidation and gradual growth. The 2020 halving saw Bitcoin’s price climb from approximately $8,000 to an all-time high of around $64,000 within a year before entering a correction phase.
The 2024 halving, although recent, has yet to follow a similar upward trajectory, with the price currently stabilizing around the $60,000 mark, hinting at the potential for further growth as market conditions evolve.
The post Bitcoin price trends post-halving: Historical data points to cyclical surges appeared first on CryptoSlate.