Bitcoin’s dormant supply rises 3%, echoing past bull run patterns
Onchain Highlights
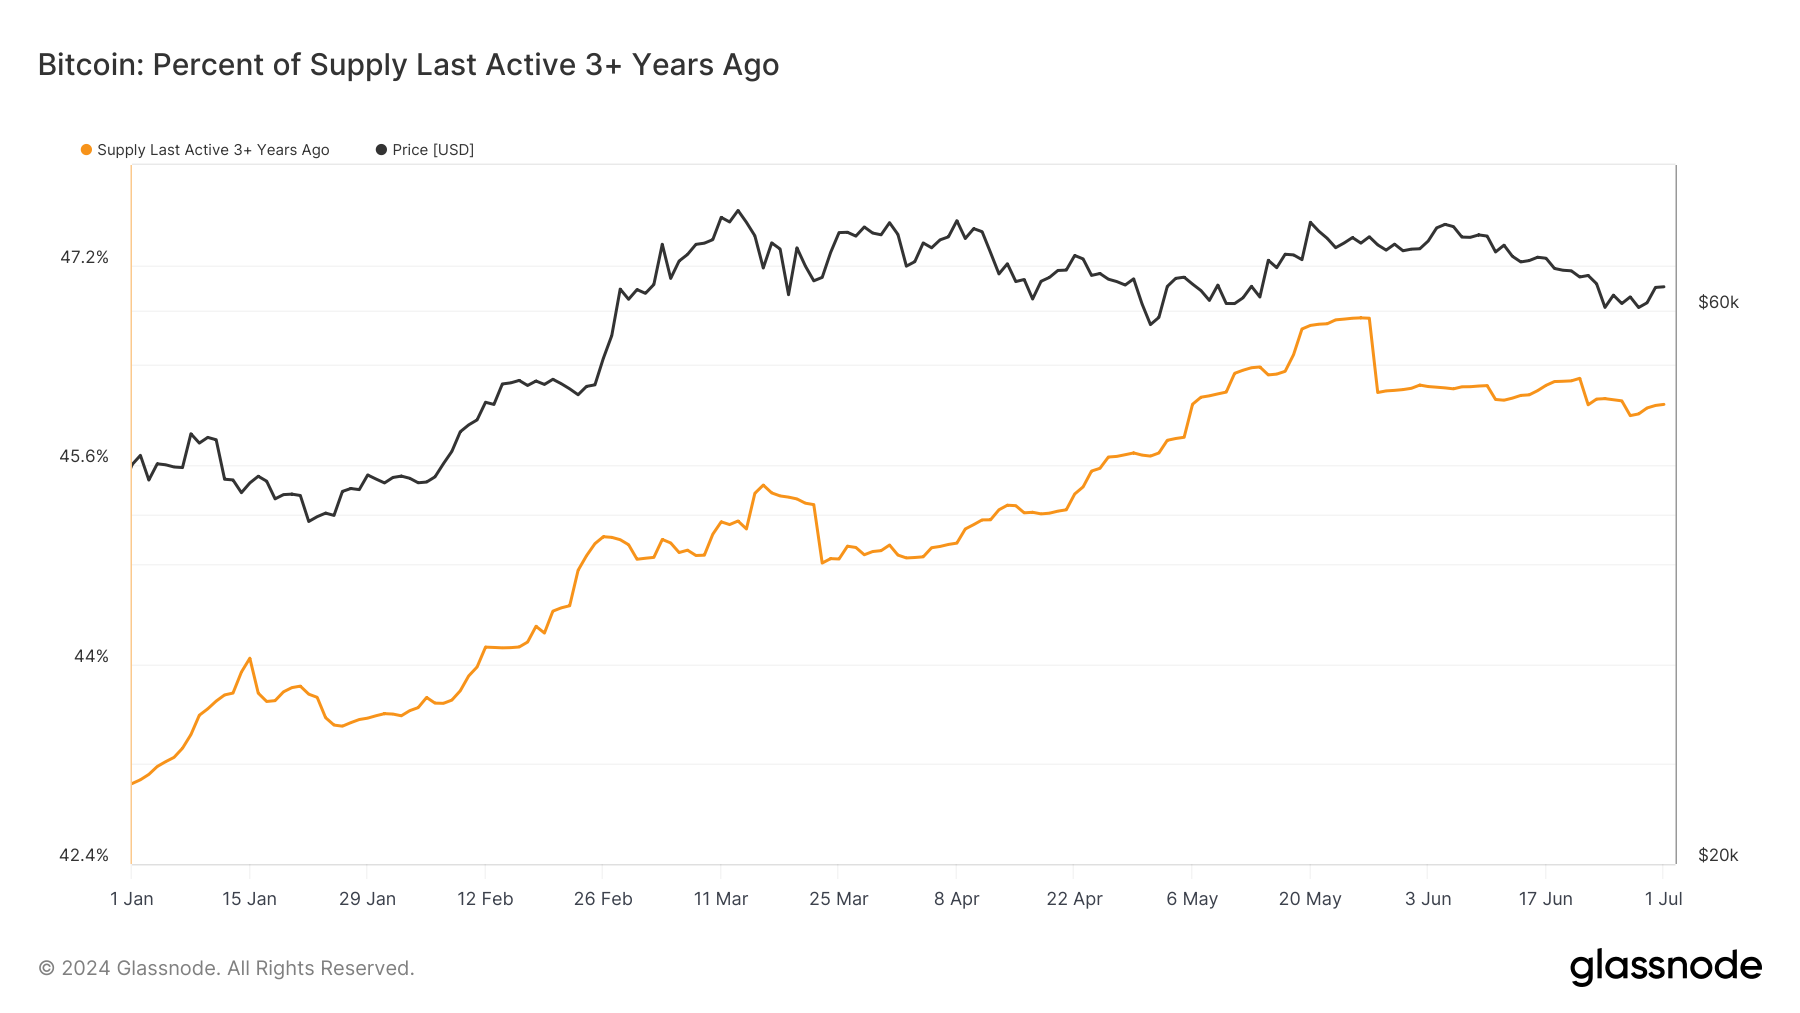
DEFINITION: The percent of circulating supply that has not moved in at least three years.
Bitcoin’s percent of supply last active over three years ago has significantly increased. The Glassnode charts reveal that from January 2024 to July 2024, this metric rose from approximately 43% to around 46.5%. This trend signifies a substantial portion of Bitcoin’s circulating supply remaining dormant, suggesting that long-term holders are not selling despite market fluctuations.
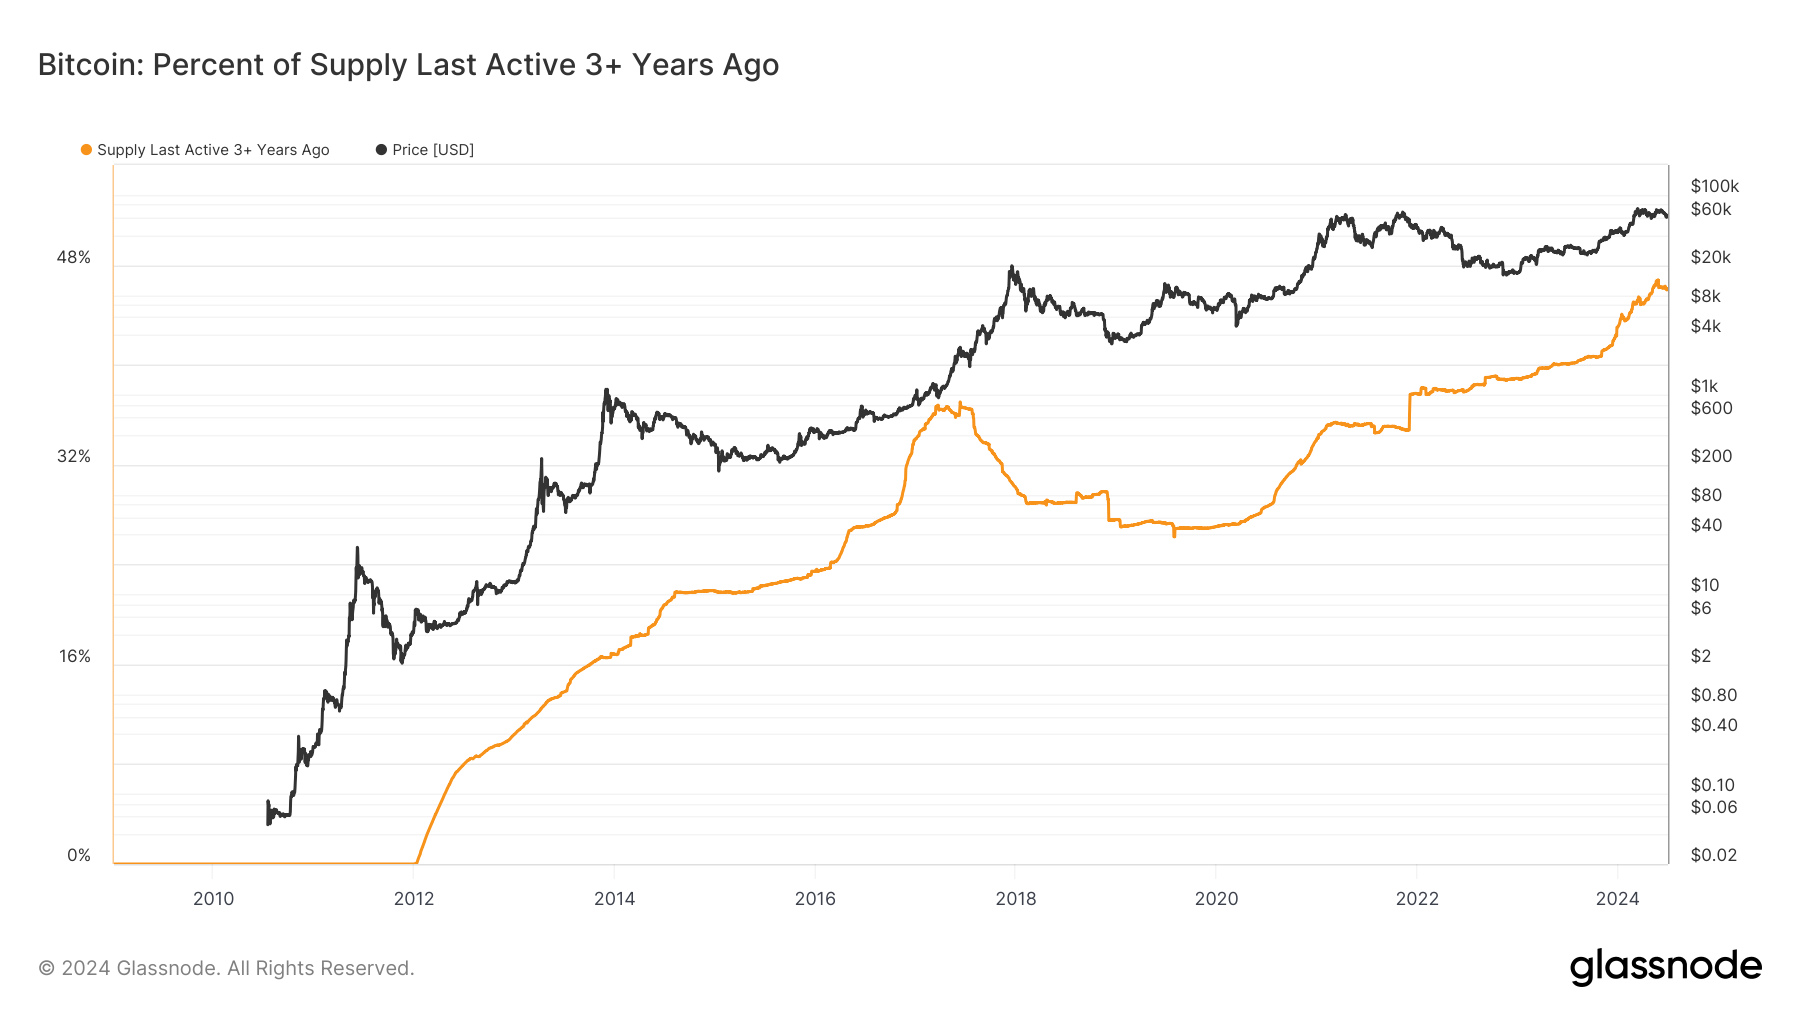
Historically, the increasing percentage of dormant Bitcoin correlates with price stabilization and potential future bullish movements. The long-term chart spanning from 2010 to 2024 shows consistent growth in this metric, aligning with significant price rallies. For instance, the percent of supply last active over three years surged during the 2017 and 2020 bull runs, reaching new highs each time.
The recent rise after the 2024 halving indicates a stronghold sentiment among investors. This behavior could imply confidence in Bitcoin’s long-term value, possibly driven by macroeconomic factors and institutional interest. As the market digests the implications of the latest halving, the growing proportion of inactive supply may serve as a barometer for future price conditions, emphasizing the strategic patience of Bitcoin holders.
The post Bitcoin’s dormant supply rises 3%, echoing past bull run patterns appeared first on CryptoSlate.