Arbitrum (ARB) Price Poised to Chart a New All-Time Low
Arbitrum’s (ARB) price is in for a major drawdown looking at not just the chart pattern but also the investors’ behavior.
Whether ARB ends up dropping to $0 or save skin before then is something to look out for.
Arbitrum Investors Prepared for Losses
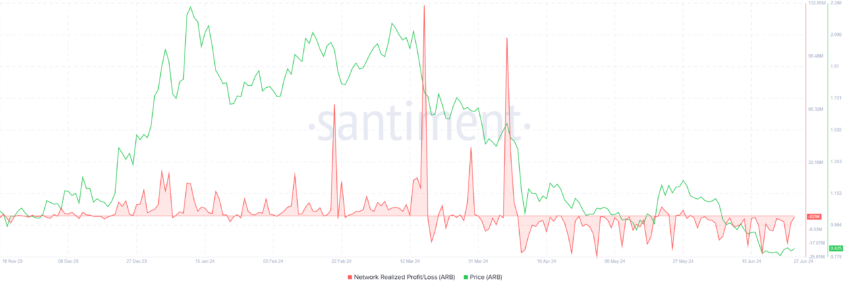
Arbitrum’s price could be looking at a new all-time low as the optimism among ARB holders has completely vanished. Arbitrum investors have been experiencing consistent losses on their transactions since mid-April. This ongoing trend is clearly highlighted by the Realized Profit/Loss metric, which underscores the financial challenges faced by the investors.
The persistent losses have significantly impacted investor sentiment, leading to a noticeable shift in behavior. Previously, many investors adopted a HODLing strategy, holding onto their assets in anticipation of long-term gains.
However, the sentiment of HODLing among Arbitrum investors has completely disappeared. The prolonged period of losses has eroded their confidence in this approach.
 Arbitrum Realized Profit/Loss. Source: Santiment
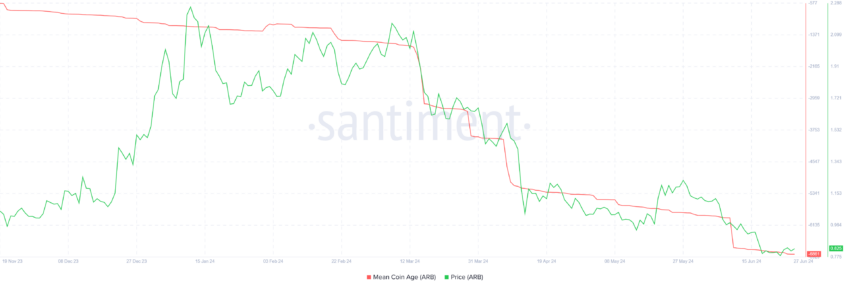
 As a result, investors are now focusing on distribution strategies, as indicated by the mean coin age metric. Mean coin age measures the average age of all coins in a network, reflecting how long they’ve been held without being moved.
An increasing mean coin age suggests accumulation and holding, while a decreasing age indicates higher trading activity. This shift suggests a preference for liquidating assets rather than holding onto them, reflecting a more cautious and reactive investment approach.
Read More: How to Buy Arbitrum (ARB) and Everything You Need to Know
 Arbitrum Mean Coin Age. Source: Santiment
 ARB Price Prediction: Forming New Lows
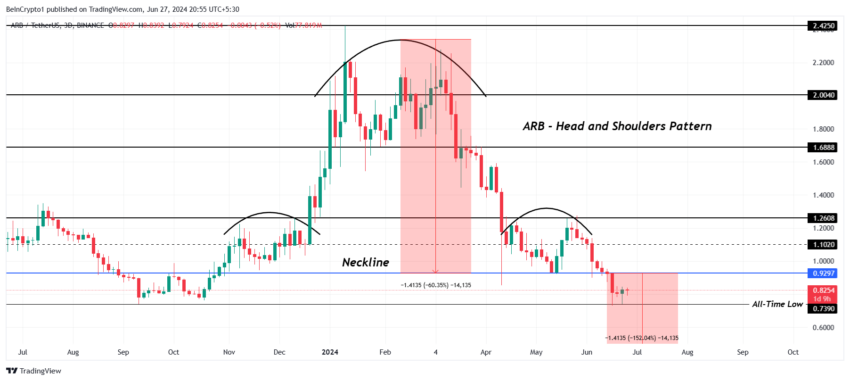
Arbitrum’s price is observing the formation of a head and shoulders pattern. The head and shoulders pattern is a bearish chart formation indicating a potential trend reversal. It consists of three peaks: a higher middle peak (head) between two lower peaks (shoulders).
Based on the technical pattern, the potential drawdown could send the altcoin down to $0 as the target is 100% below the neckline at $0.92. However, this is impossible since even during the FTX collapse, its native token, FTT, did not slip to $0.
Thus, the more practical outcome is Arbitrum’s price hitting a new all-time low. The current ATL lies at $0.73 and marking a lower low below this would not be surprising.
Read More: Arbitrum (ARB) Price Prediction 2024/2025/2035
 Arbitrum Price Analysis. Source: TradingView
 But if by the mercy of ARB holders, the altcoin manages to bounce back Arbitrum’s price could bounce back. Potentially breaching the neckline at $0.92 will enable recovery and reclaiming $1.0 will invalidate the bearish thesis.


