BloFin Whale’s View: Magnificent 3
Similar to the US stock market, the liquidity of the crypto market is further concentrated in mainstream cryptos such as BTC, ETH, and USDT. These cryptos have wider channels and more tools to obtain liquidity and can better withstand the long-term high interest-rate environment. In contrast, after 1-2 realized interest rate cuts, the performance of altcoins may improve.
“It’s the Liquidity, Mate”
The bull market never appears in just one market. While crypto investors enjoy the bull market cycle, the Nasdaq and the S&P 500 are continuously hitting new highs; precious metals such as gold and silver are also not to be outdone, and their performance has reached the best level in nearly five years.
In the interest rate market, traders optimistically estimate that the Fed will start cutting interest rates in Sept, and 4-5 rate cuts in the next 15 months will allow global investors to enjoy a feast no less than the bull market cycle in 2021.
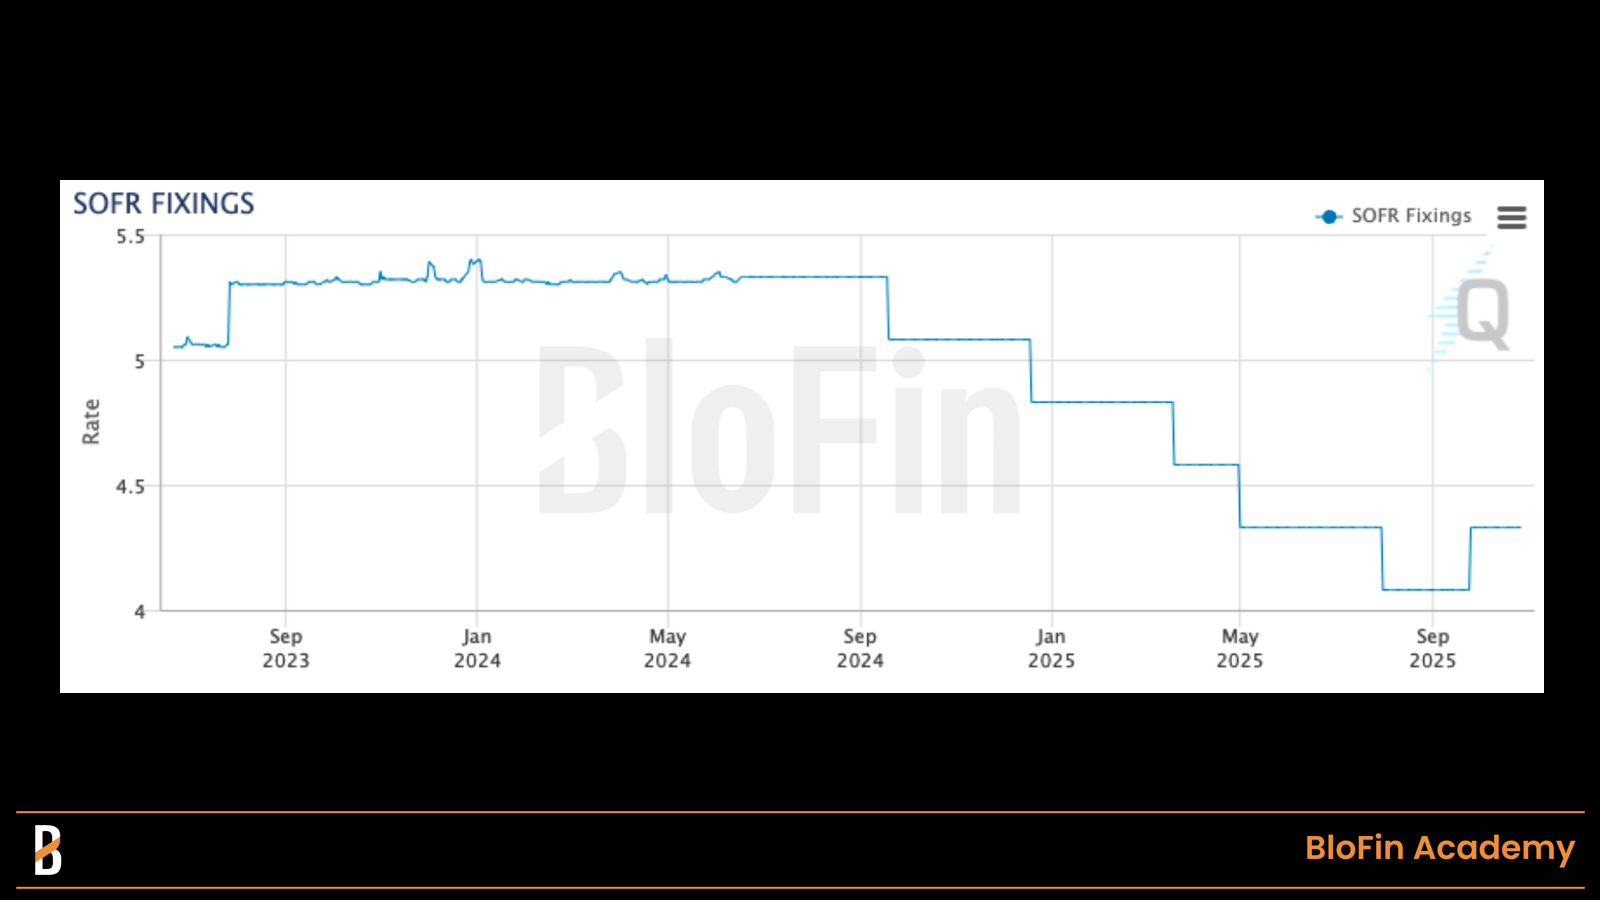
SOFR fixing rate, which directly reflects inter-bank financing costs. Source: CME Group
However, unlike the previous bull market, which was caused by zero interest rates and excessive liquidity, this bull market was born against the backdrop of high interest rates. We are experiencing the highest interest rate period since the beginning of the 21st century; only the internet bubble cycle from 1995 to 2001 can be compared. Interestingly, these two bull market cycles also have many similarities.
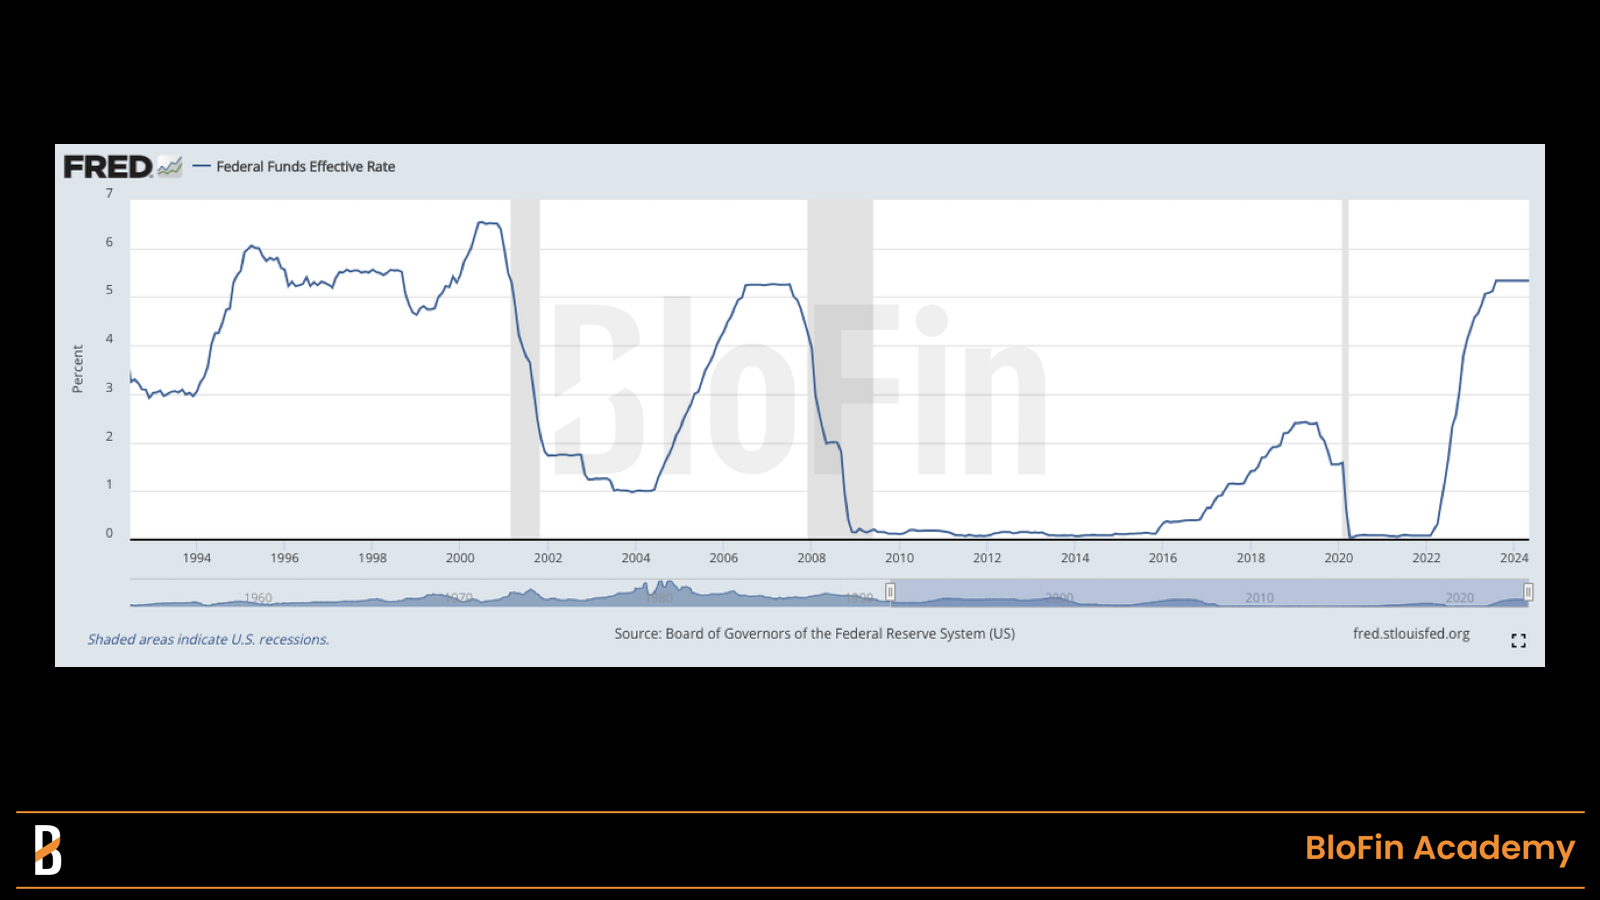
Changes in the effective rate of Fed funds, as of Jun 2024. Source: FRED
The US banking crisis of 2023 was impressive. However, similar events occurred in the 1980s and 1990s, and the scale is no less than that of 2023. If inflation is considered, the impact of that year’s bank failures may be even more significant.
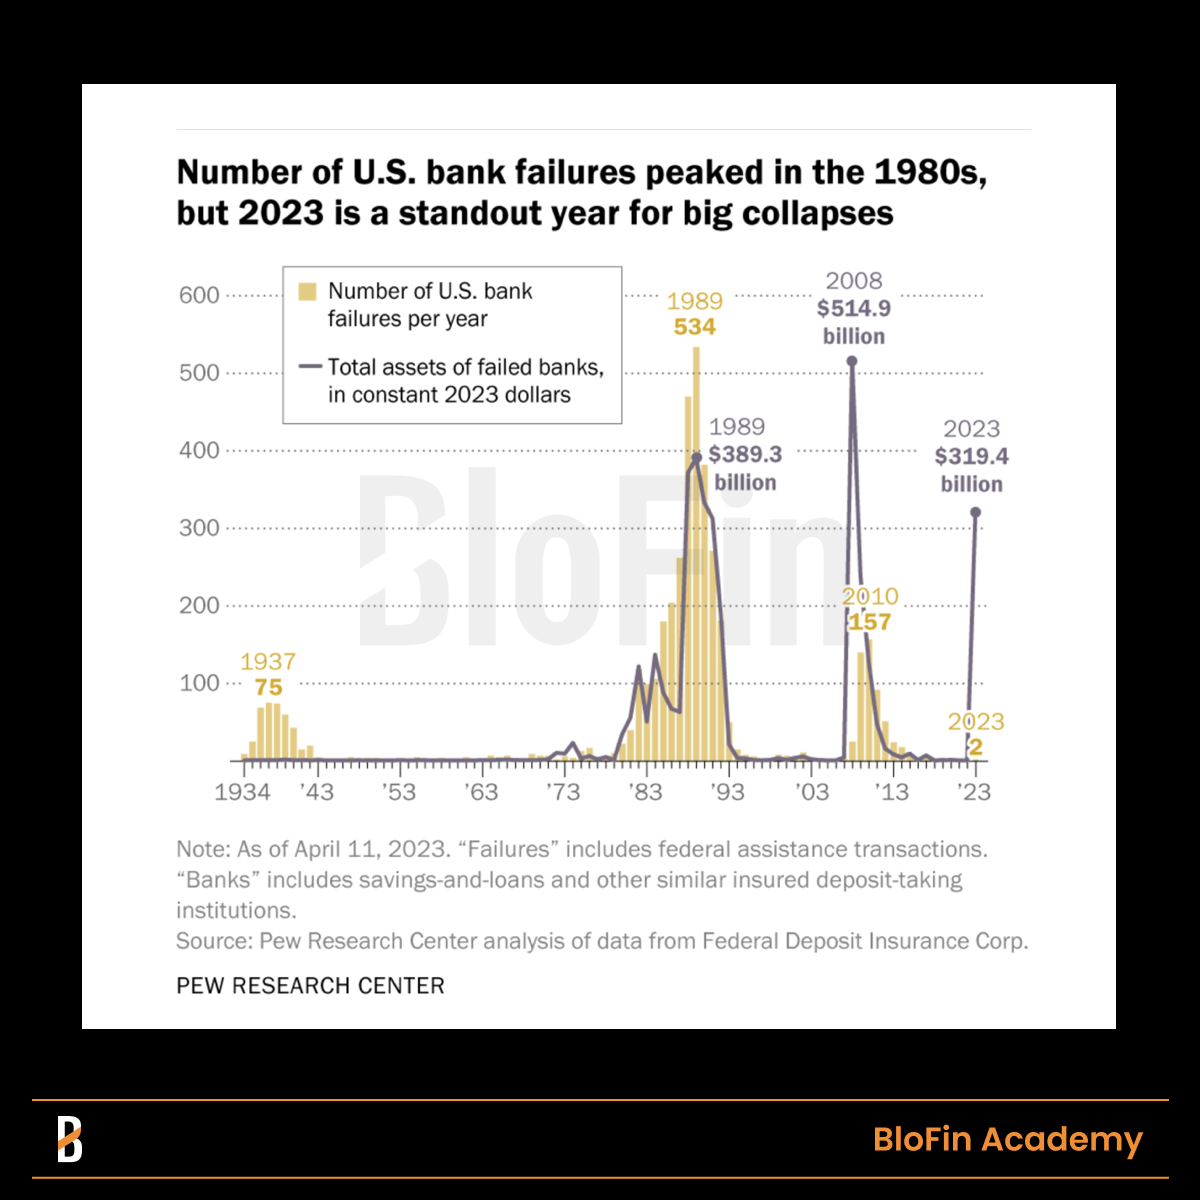
The number of US Bank failures since 1934. Source: PEW Research Center
The large number of bank failures seriously hit investors’ confidence in the banking system and savings deposits. Although Greenspan and Powell chose to make high interest rates long-term, more investors still gave up deposits and risk-free returns instead of investing their funds in risky asset markets. This led to a significant slowdown in the growth rate of deposit size in the 1990s, and a similar situation occurred again 30 years later.
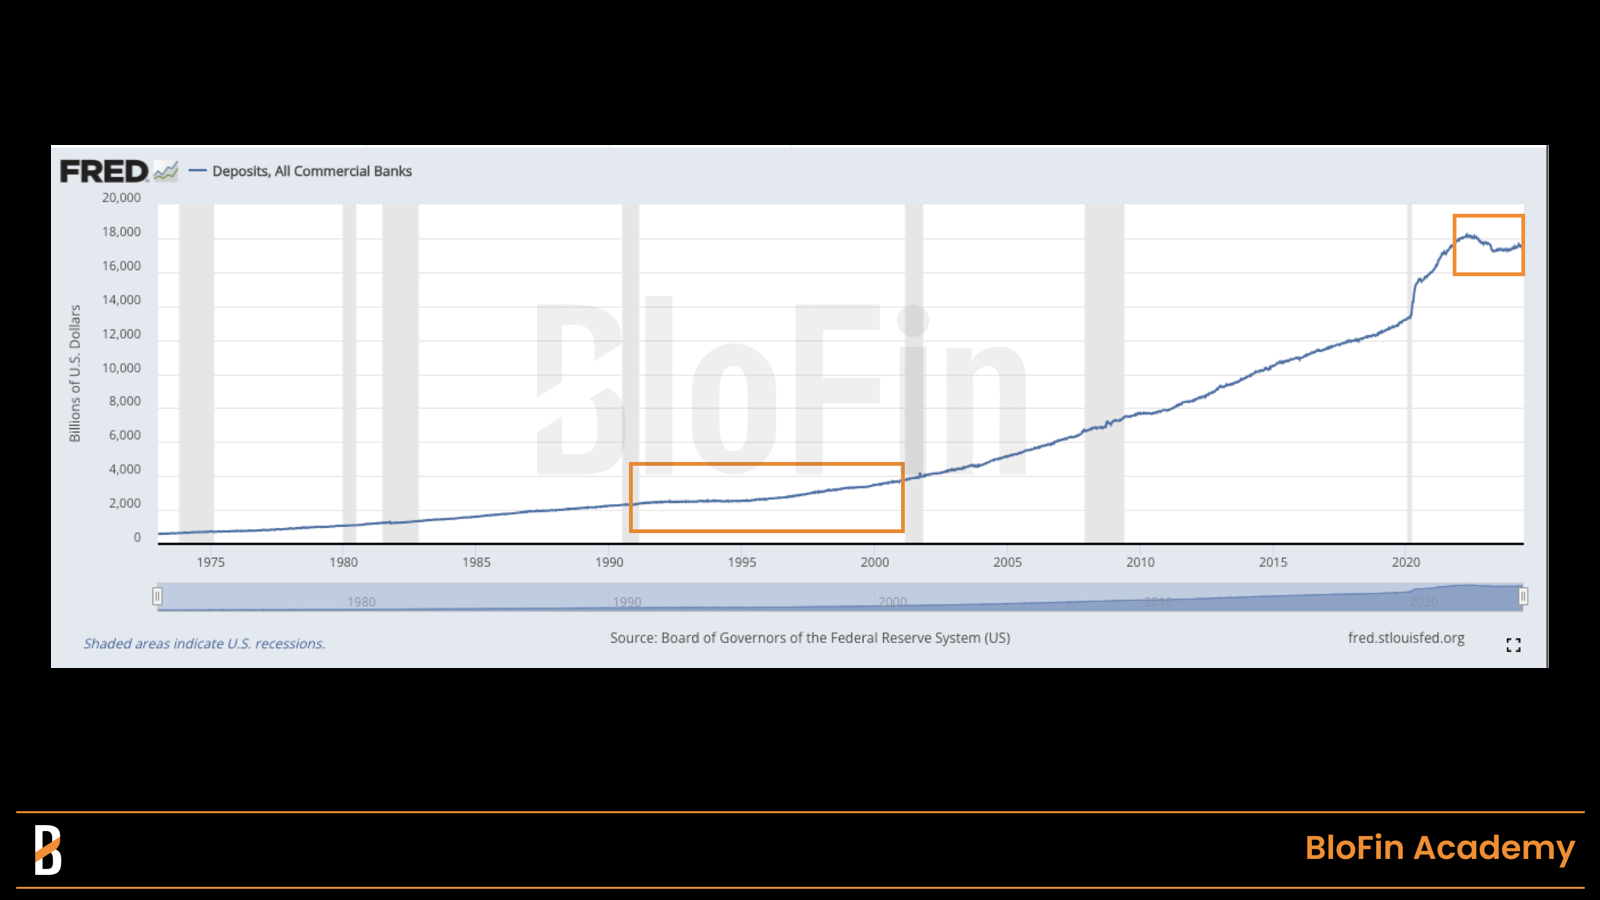
Changes in the scale of deposits in commercial banks, as of Jun 2024. Source: FRED
However, even if investors choose to enter the risky asset market, they remain cautious: they usually prefer to invest in stocks and other assets with sufficient potential, large market capitalization, and attractiveness. In 2000, the “Internet revolution” was about to peak; in 2024, AI was emerging. Both generations of investors chose to buy into the future; in 2000, the baby boomer generation held MSFT, CSCO, and INTC. Now, their children are holding NVDA, BTC, and ETH.
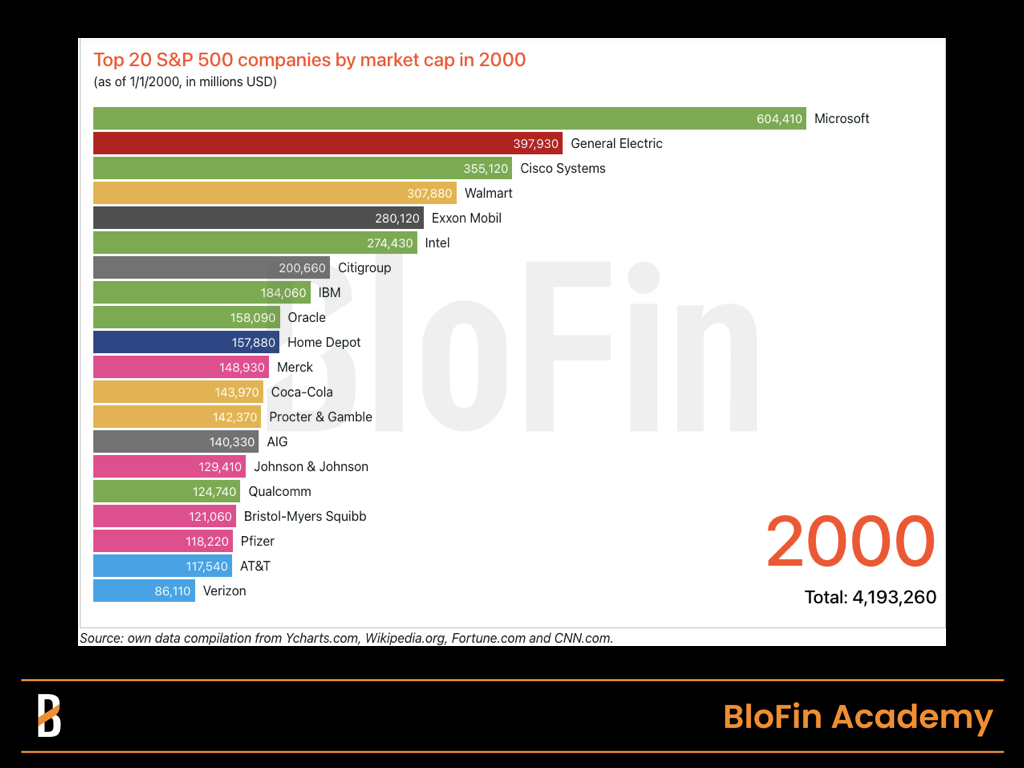
Top 20 S&P 500 companies by market cap in 2000. Source: Finhacker
Hey! Don’t forget that we are still in a high-interest-rate environment. Despite the liquidity from multiple sources, such as deposits and salaries supporting the prices of risky assets, investors still cannot laugh off the losses of investment failures as they did during the liquidity flood.
The above has led to an interesting phenomenon. Although investors are willing to hold risky assets and invest in new narratives, they still hope to seek targets with sufficient risk resistance in the risky asset market to some extent. There is no better choice than large-cap stocks: they have enough liquidity, enough derivatives for hedging risks, and a large enough investor base.
As a result, the Matthew effect emerged: investors flocked to buy large-cap stocks as “safe havens,” further pushing up their market cap and attracting more investors with similar ideas. Eventually, the market concentration rose higher. In 2000, the total market cap of the Top 10 stocks accounted for 27% of the total market cap of the S&P 500 index, reaching a new high in decades. This proportion has reached 33.5% today, even higher than before.
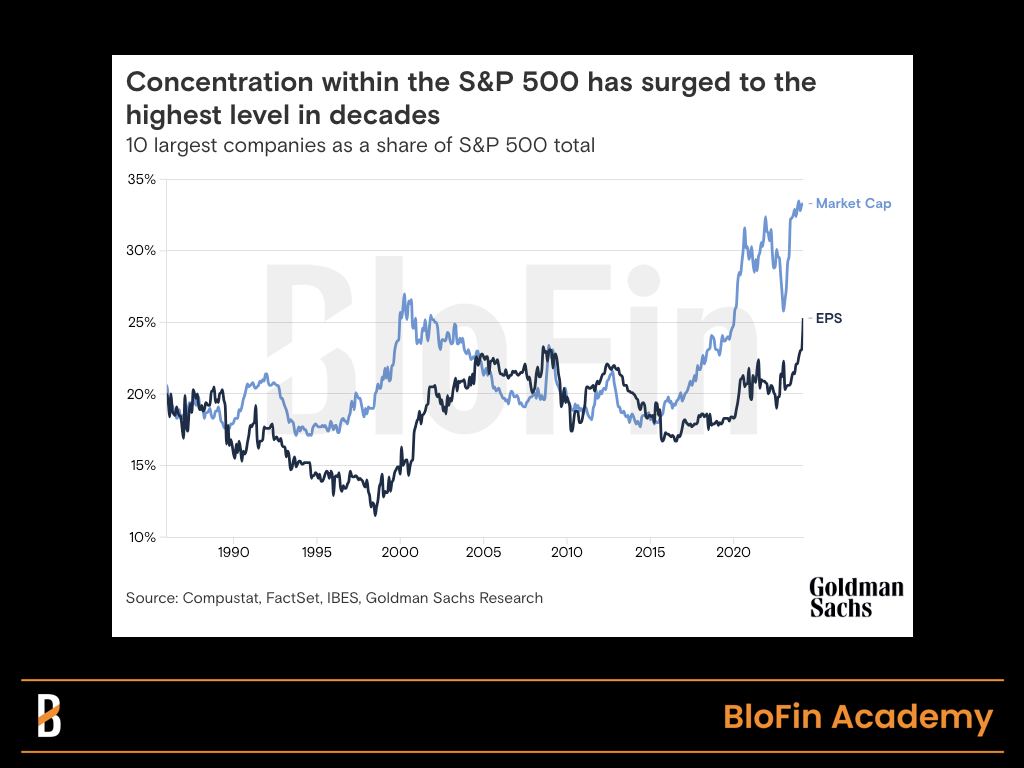
Changes in the concentration level of S&P500, as of Jun 2024. Source: Goldman Sachs
For the crypto market, we are also going through a similar process. Magnificent 7 dominates the US stock market, while Magnificent 3 (BTC, ETH, and USDT), supported by numerous ETF providers and sought after by investors, occupies over 77% of the crypto market cap. MegaCap cryptos have also achieved more robust returns than altcoins. For HODLers, holding BTC and ETH is a perfect business. Investors can earn an average annual return of over 50% in the past five years by simply buying and holding. In contrast, the returns from altcoins are somewhat insignificant.
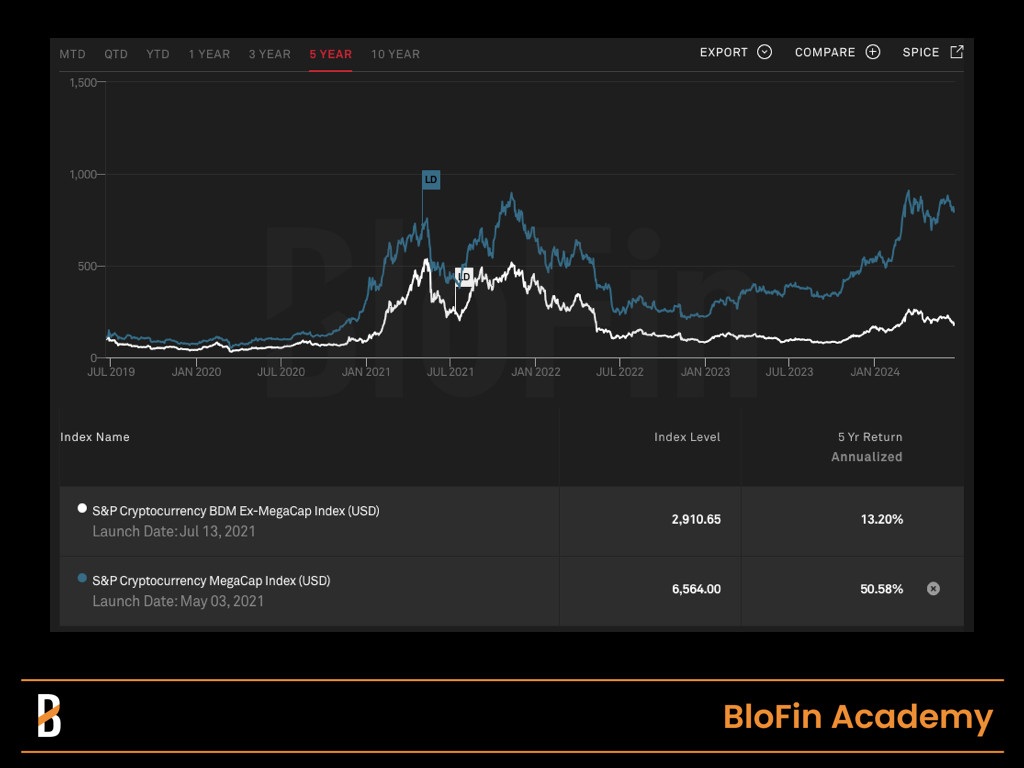
Comparison between the performance of MegaCap cryptos and Ex-MegaCap cryptos, as of Jun 2024. Source: SP Global
Obviously, the current macro environment is favourable for Magnificent 3 cryptos to gain more market cap. Since the beginning of 2024, the market share of altcoins has dropped from 22% to around 16%. The high interest rate environment will continue for months, so it isn’t easy to see better performance of altcoins in the short term.
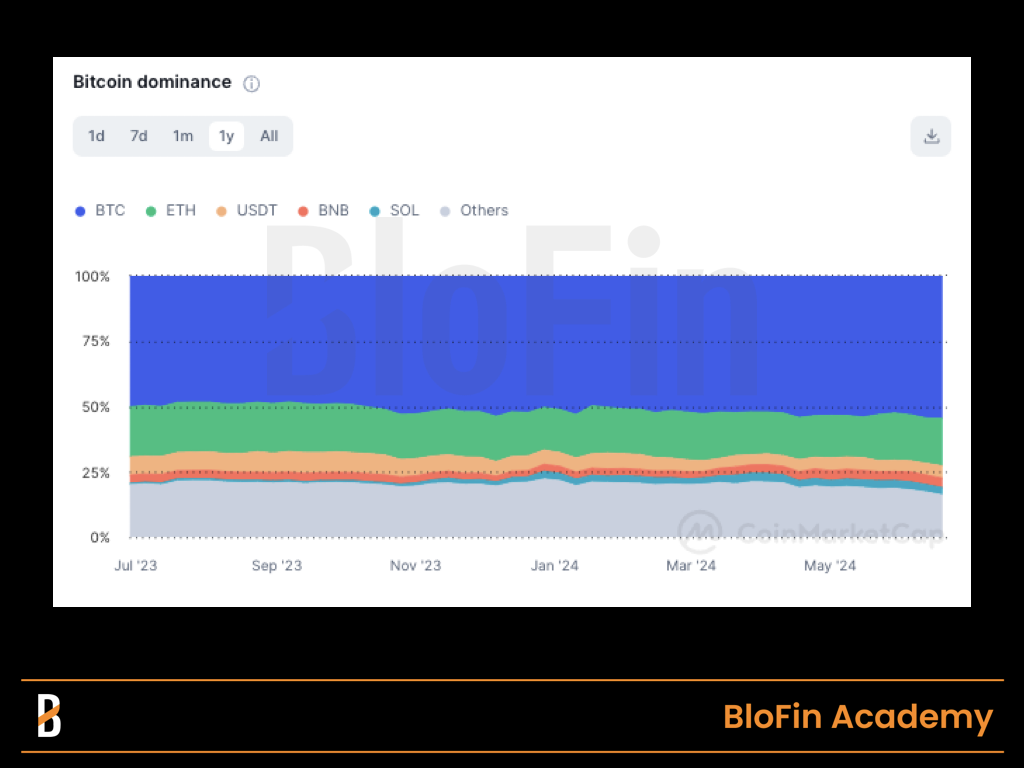
Changes in cryptos’ market shares in the recent 12 months. Source: Coinmarketcap
Competition Between Giants: ETH’s Turn?
Of course, investors’ investment in Magnificent 3 is not fixed. As the spot ETH ETFs’ official listing date approaches, traders have gradually adjusted their investment portfolios. The relative strength of BTC has lasted for several months, but investors are changing their views: they seem to believe that the performance of ETH will strengthen for some time with the listing of the spot ETH ETFs.
The skewness data of options intuitively reflects the change in investors’ expectations. For most of the year, BTC’s skewness data has been more bullish than ETH’s. However, in recent weeks, this situation has reversed. Investors’ expectations for BTC’s short-term performance are biased towards “neutral” and “slightly bearish,” while ETH’s short-term performance is relatively more bullish.
Investors still maintain an apparent, bullish attitude towards the medium and long-term performance of BTC and ETH. However, their bullish attitude towards ETH has exceeded that towards BTC. One possible reason is that assets with relatively low market cap and relatively high volatility have a better potential for returns during the interest rate cut cycle. In addition, the “asset allocation period” after the approval of the spot ETH ETFs will positively impact ETH’s price, as BTC experienced in February and March.
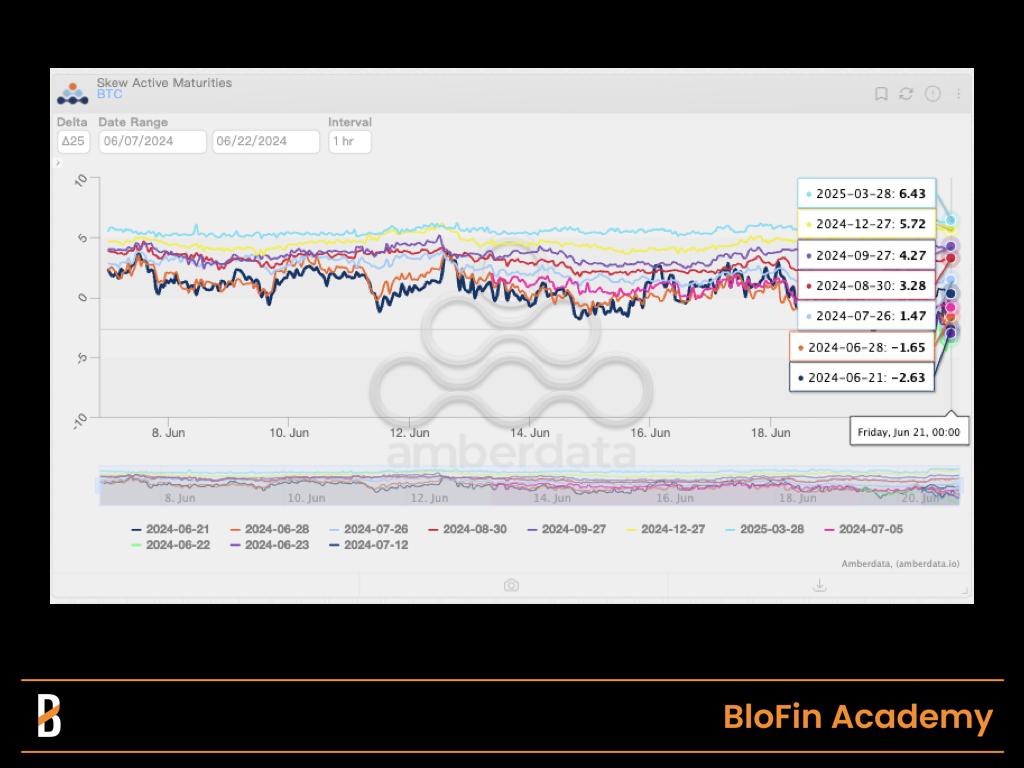
Changes in BTC 25delta skew in the recent 14 days. Source: Amberdata Derivatives
Changes in ETH 25delta skew in the recent 14 days. Source: Amberdata Derivatives
The pricing of the “asset allocation period” can also be traced. The latest forward exchange rate term structure of ETH/BTC implies that investors believe that ETH will perform better than BTC in the next few months and push the exchange rate higher in the short term. The Risk Premium difference between ETH and BTC has also converged to within 25bps, and investors are looking forward to the potential new wealth effect brought by ETH after the listing of spot ETH ETFs.
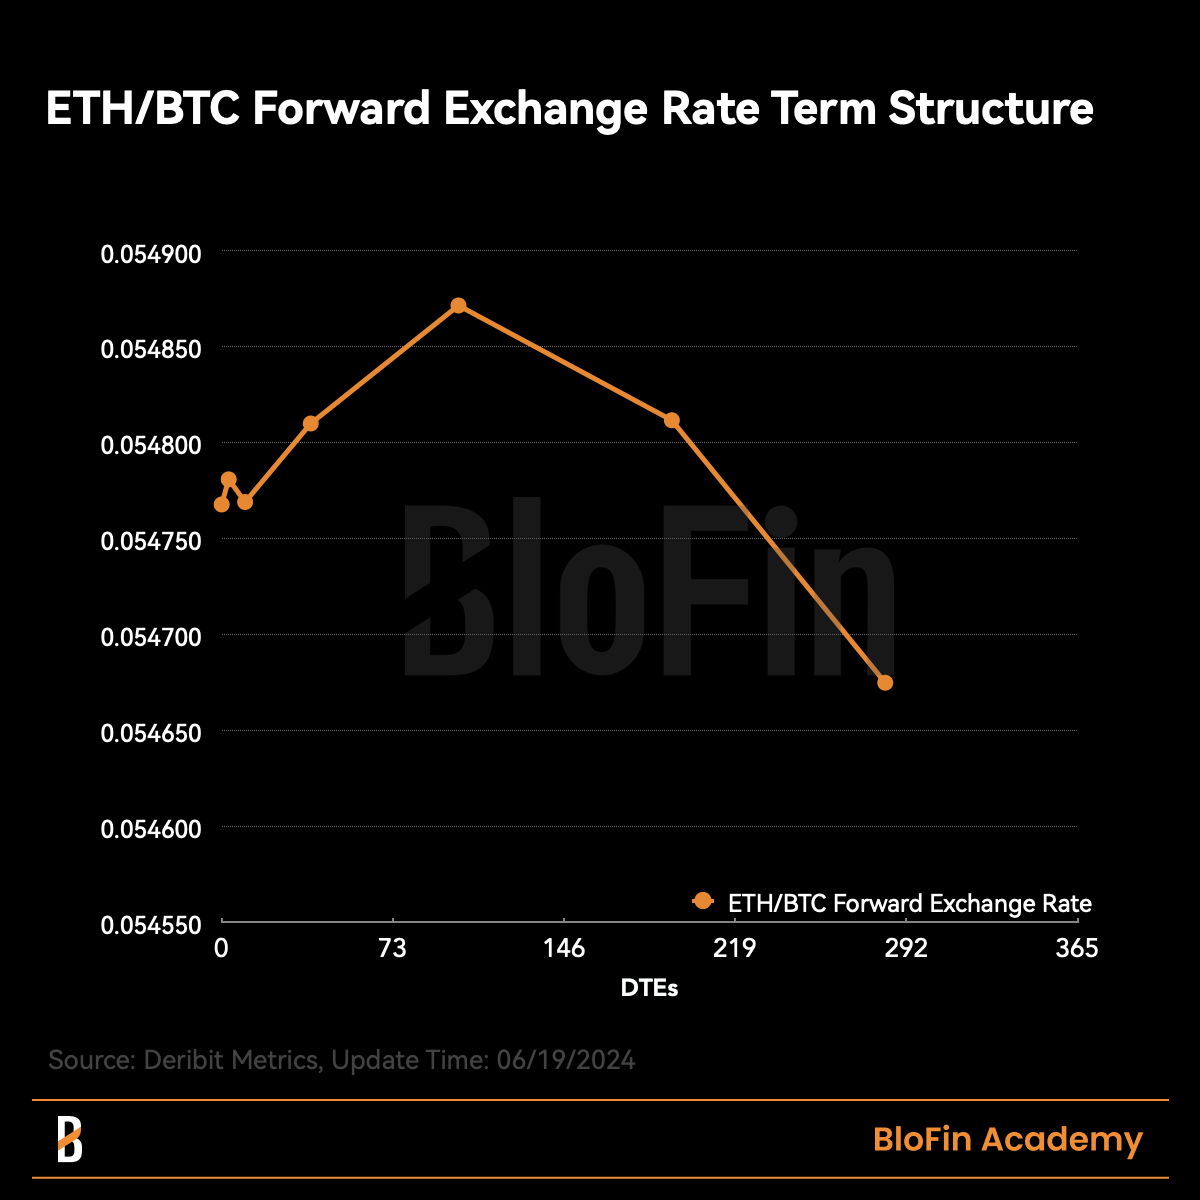
ETH/BTC Forward Exchange Term Structure. Source: Deribit Metrics
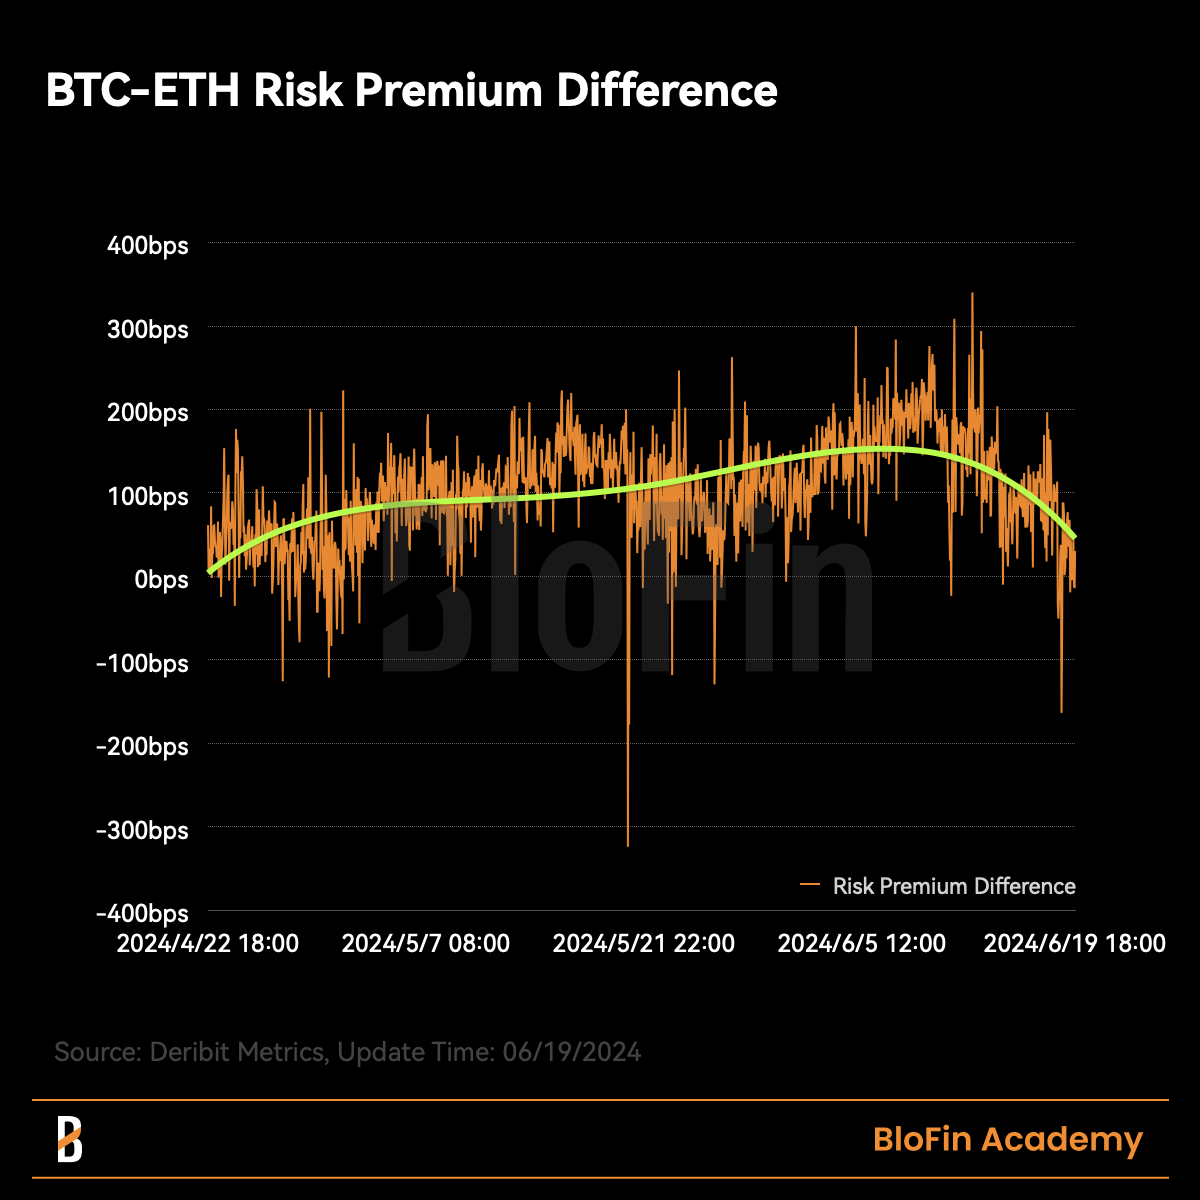
BTC-ETH risk premium difference. Source: Deribit Metrics
From the perspective of volatility, investors also expect that ETH may experience relatively higher fluctuations in the coming months (17.6%/30 days, 33.5%/90 days). Ideally, it is not difficult for ETH to break through $4.1k; considering that ETH currently has more negative gamma than BTC, the hedging behaviour of market makers will become a significant force driving up prices.
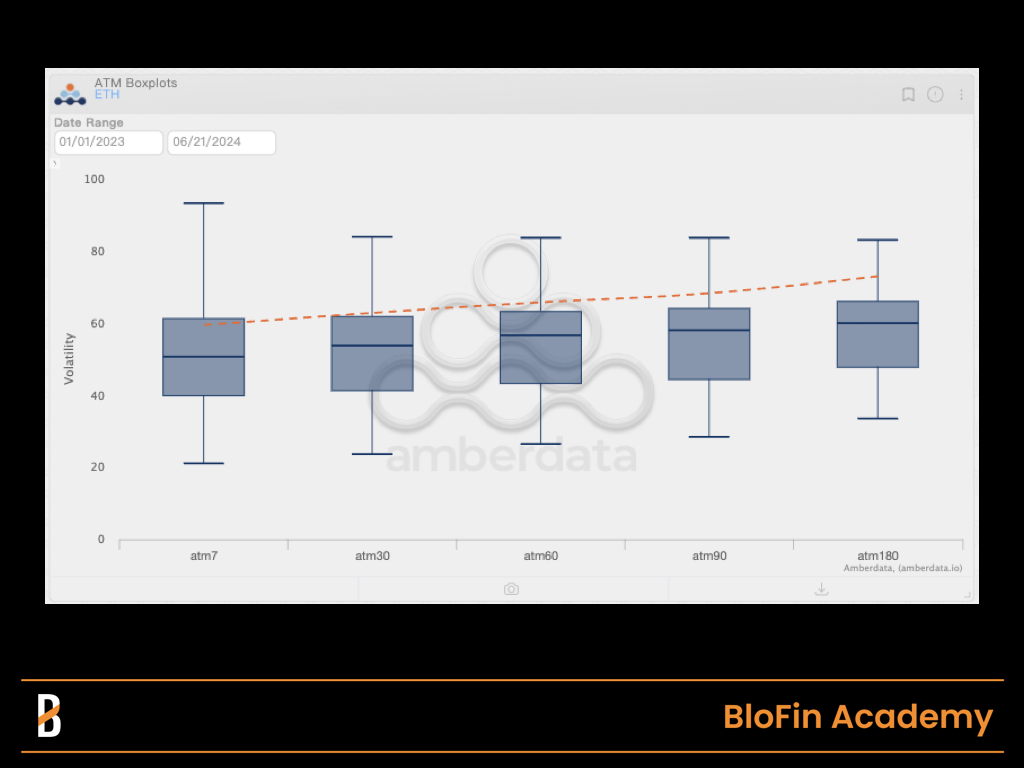
ATM boxplots of ETH. Source: Amberdata Derivatives
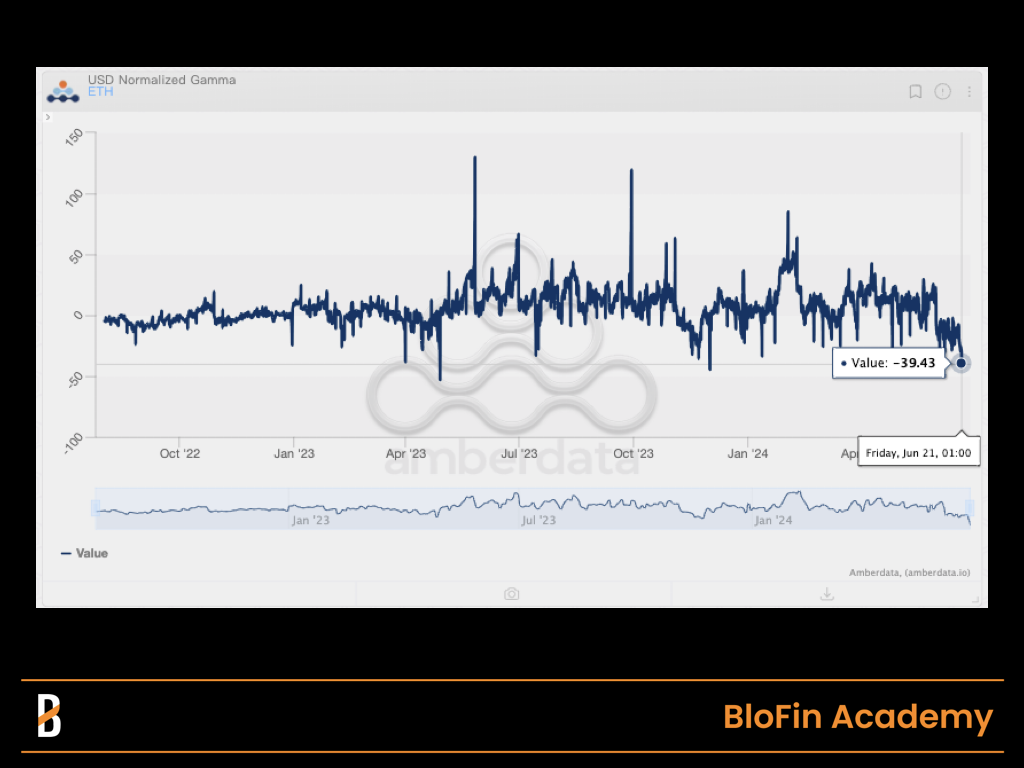
The latest USD normalized gamma of ETH. Source: Amberdata Derivatives
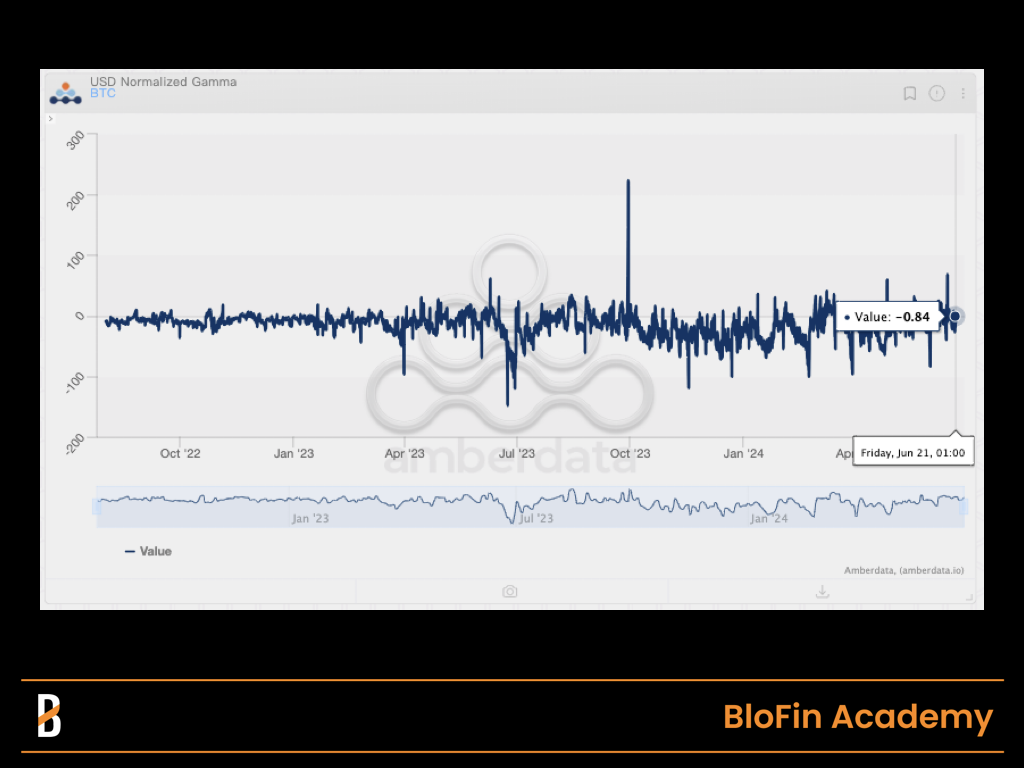
The latest USD normalized gamma of BTC. Source: Amberdata Derivatives
In the spot market, ETH whales have also stopped reducing their holdings of ETH. Interestingly, whales have reduced their holdings of BTC in recent months; this may be due to miners regularly selling BTC for cash, but obviously, we cannot rule out the possibility of portfolio adjustments.
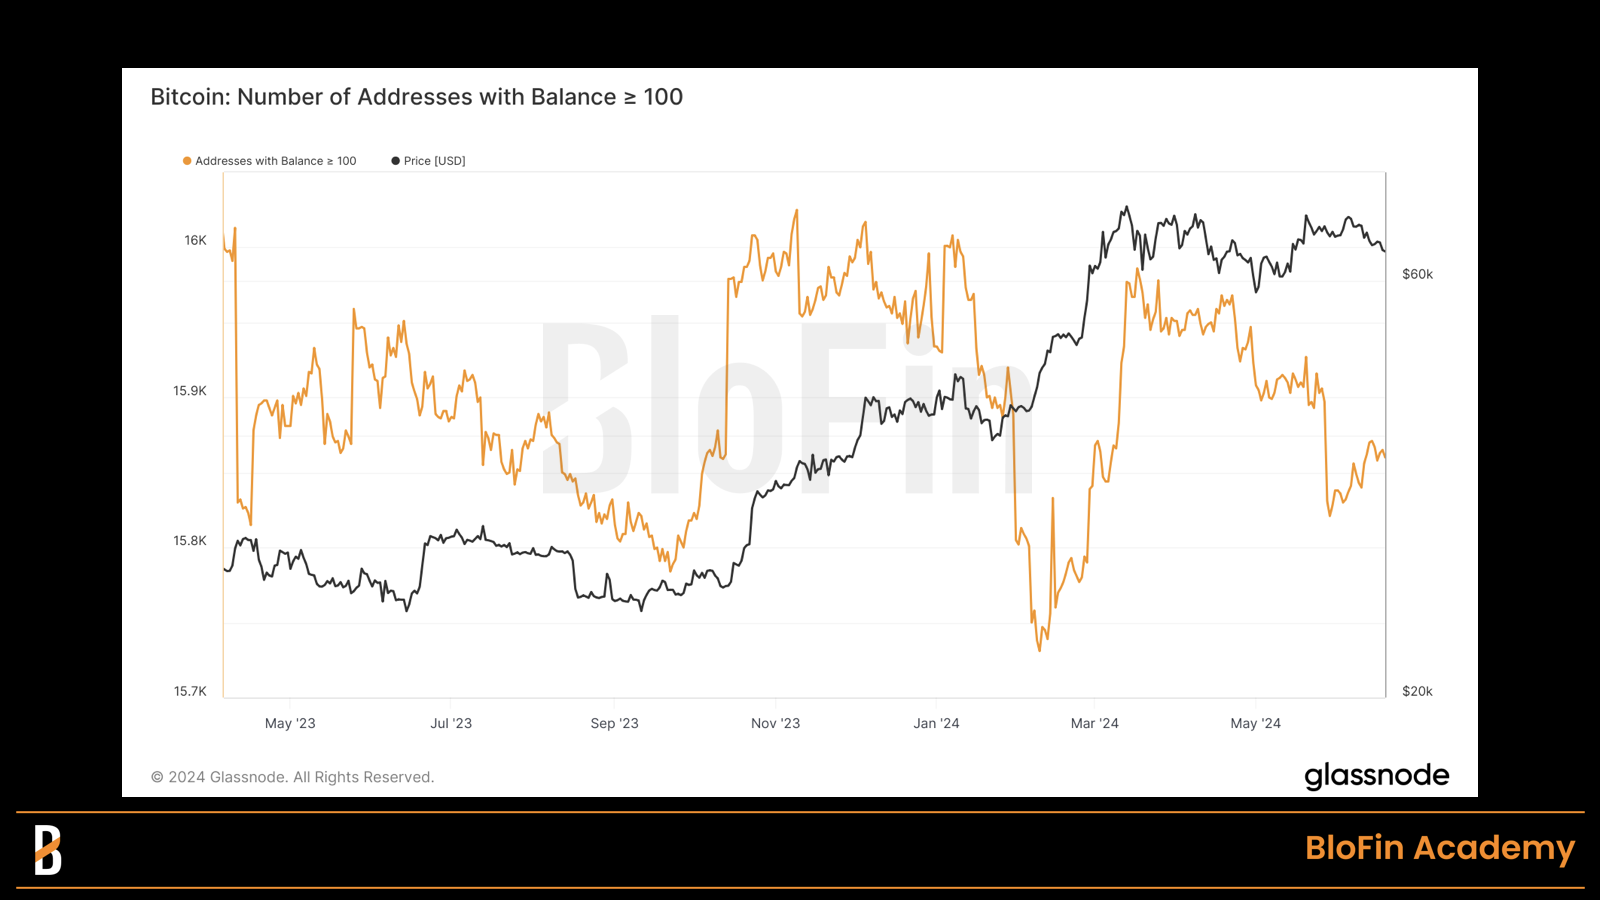
The number of addresses with BTC balances higher than 100, as of Jun 21, 2024. Source: Glassnode
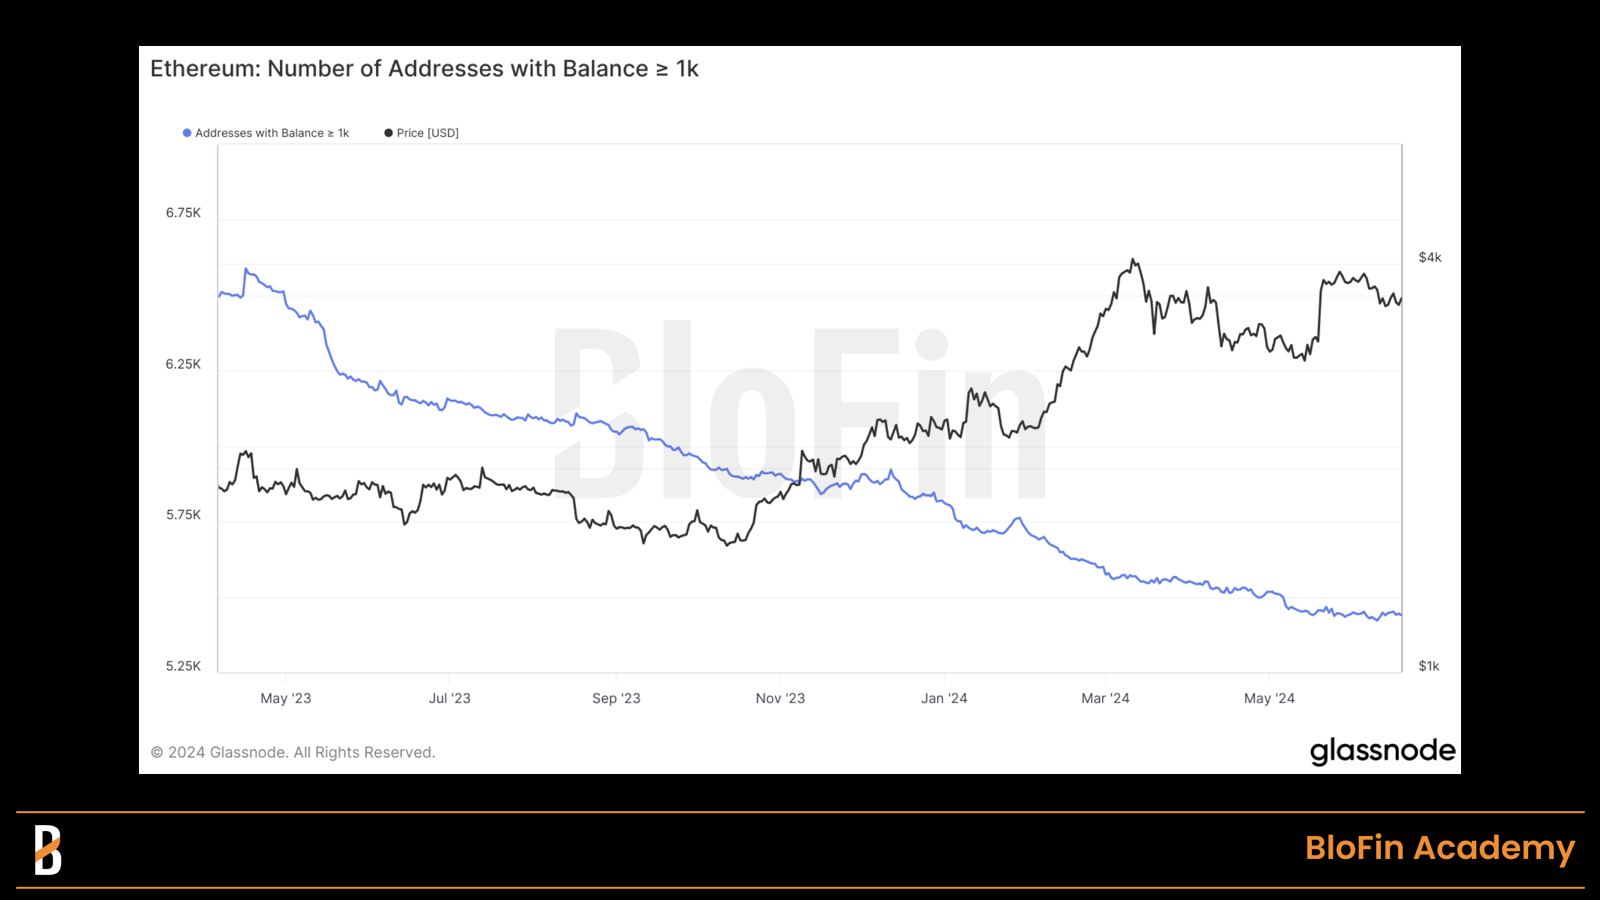
The number of addresses with ETH balances higher than 1,000, as of Jun 21, 2024. Source: Glassnode
Overall, increasing some ETH-long exposure in the near future is a more appropriate choice. Besides, long-term holding is not a problem for BTC, but “wait and see” may be one of the few options for altcoins.