Daily Market Review: BTC, ETH, XRP, SOL, NOT
Today’s market session has seen bulls on the front foot, as seen from the increase in the global market cap. The total cap stood at $2.27T as of press time, representing a 0.26% increase over the last 24 hours. On the other hand, the trading volume has dropped by 27.4% over the same period to stand at $62.09B.
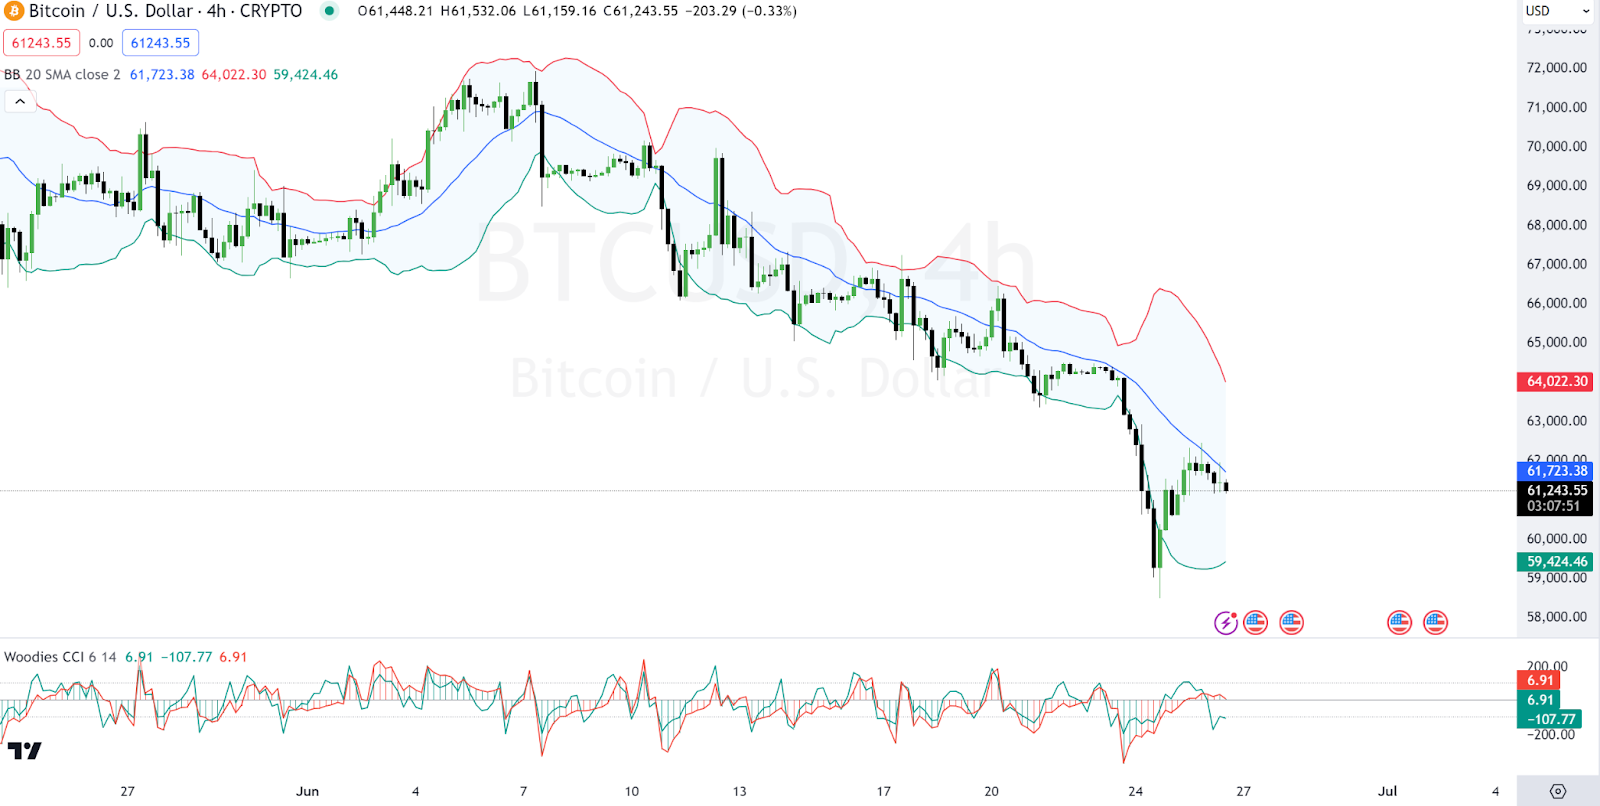
Bitcoin Price Review
Bitcoin (BTC) is now facing consolidation after a short recovery run earlier. An in-depth analysis shows that the *BTC* chart shows a clear downtrend, as indicated by the Bollinger Bands and the moving average. Prices consistently trade below the middle Bollinger Band and the moving average line, highlighting bearish momentum.
On the other hand, the Woodies CCI shows readings predominantly below zero, indicating a bearish market sentiment. As of press time, Bitcoin traded at $60,859, representing a 1.03% decrease over the last 24 hours.
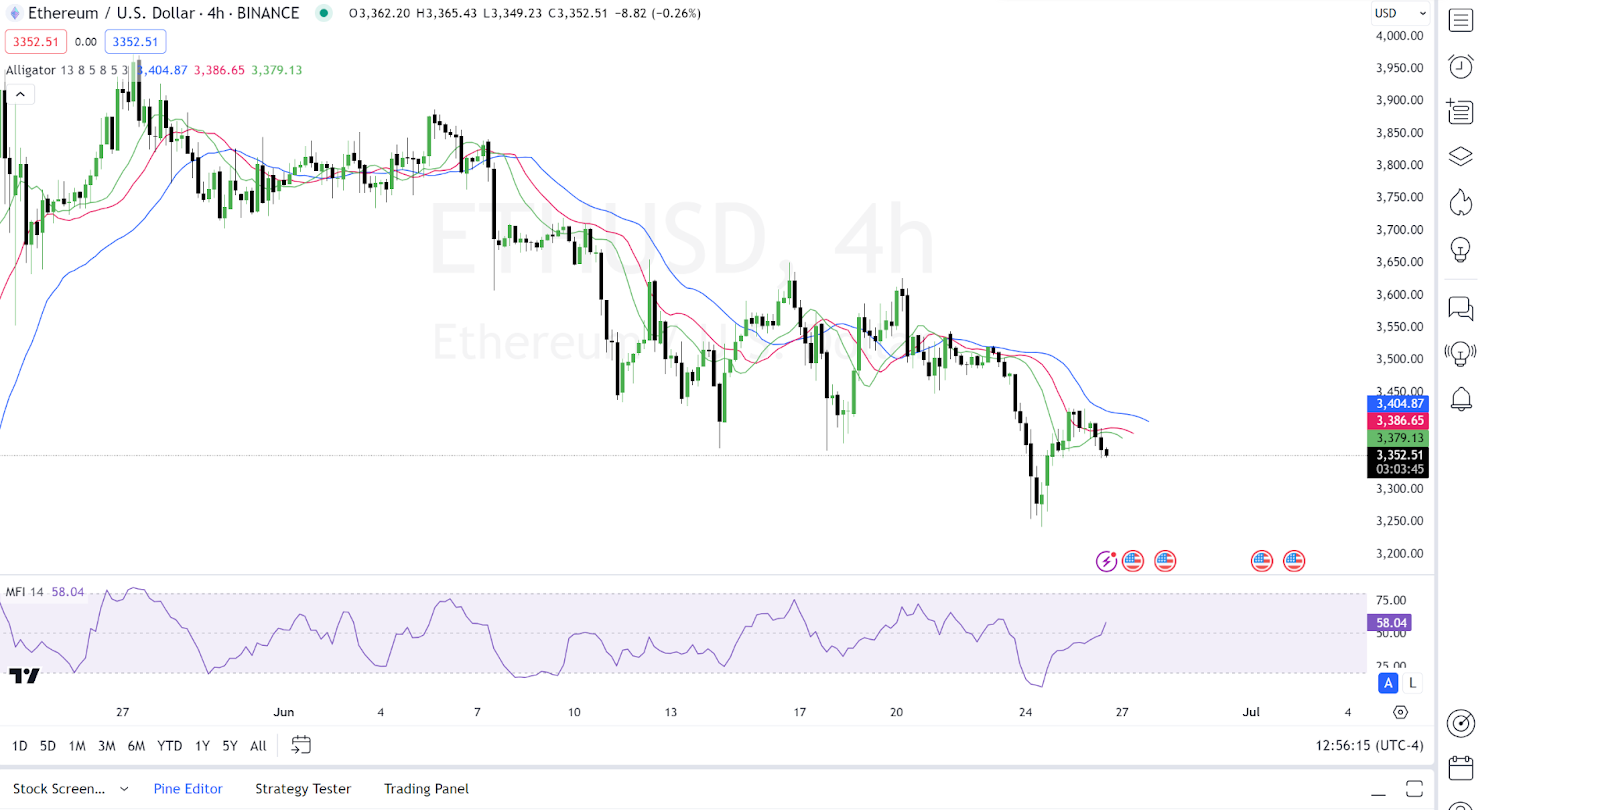
Ethereum Price Review
Ethereum (ETH) also failed to post gains in today’s session, as seen from its price movements. In-depth analysis shows that the *ETH* price is below the ‘jaws’ of the Alligator (red line), confirming a bearish trend.
On the other hand, the Money Flow Index (MFI) of around 58 suggests moderate buying pressure, not particularly strong given the overall downtrend. Ethereum traded at $3,341 as of press time, representing a 1.6% decrease over the last 24 hours.
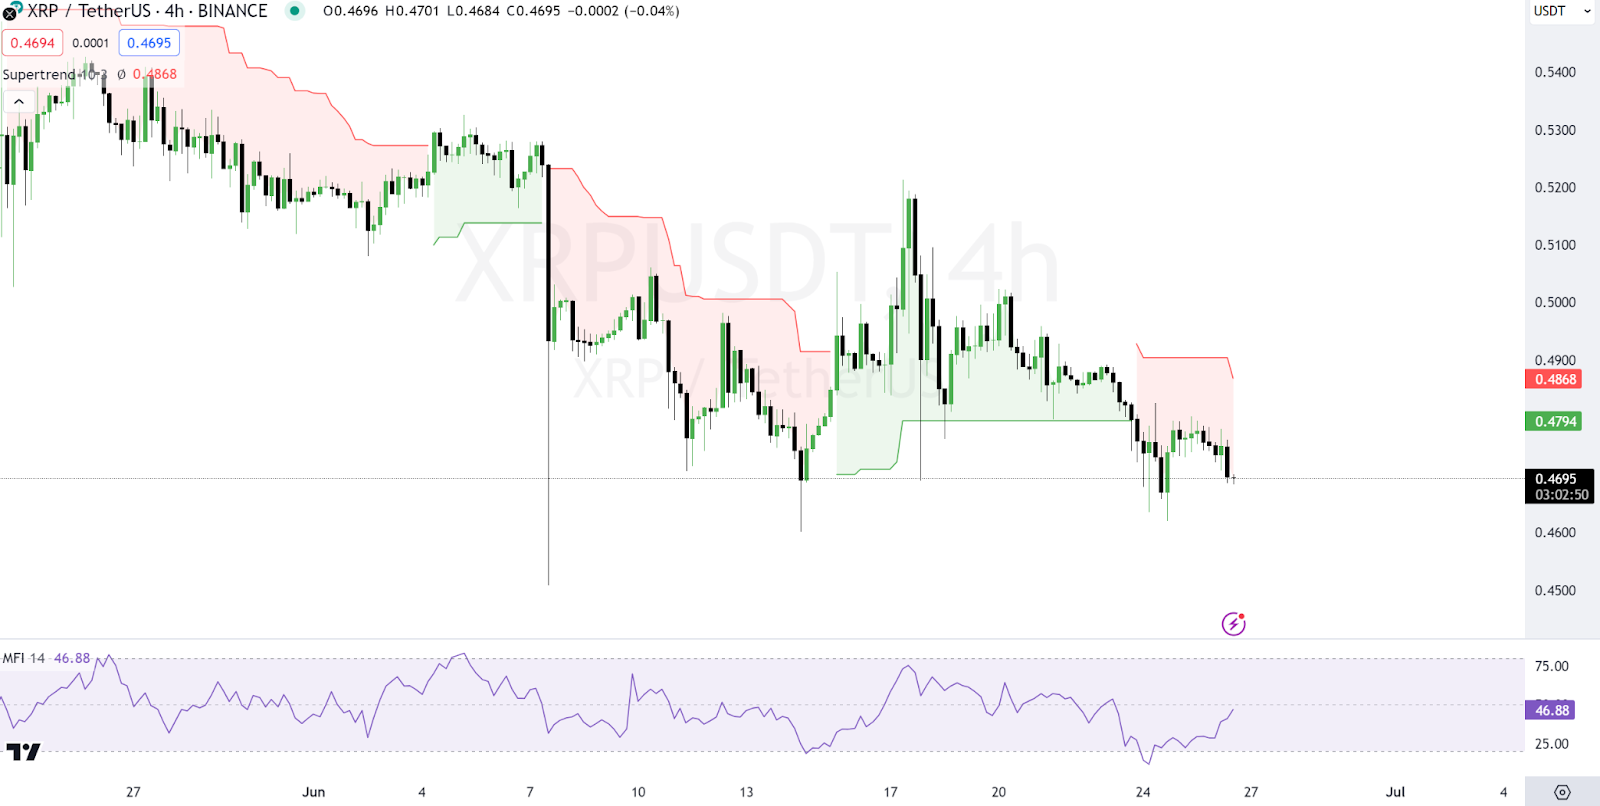
Ripple Price Review
Ripple (XRP) has also failed to post gains in today’s session, as seen from its price movements. An in-depth analysis shows that the Supertrend indicator indicates a bearish trend as the *XRP* price is below the indicator line.
On the other hand, Looking at other indicators, we see that the Money Flow Index (MFI) holds a lower value (around 46.88), indicating weak buying pressure and potential continuation of the downtrend. Ripple traded at $0.467 as of press time, representing a 2.39% decrease over the last 24 hours.
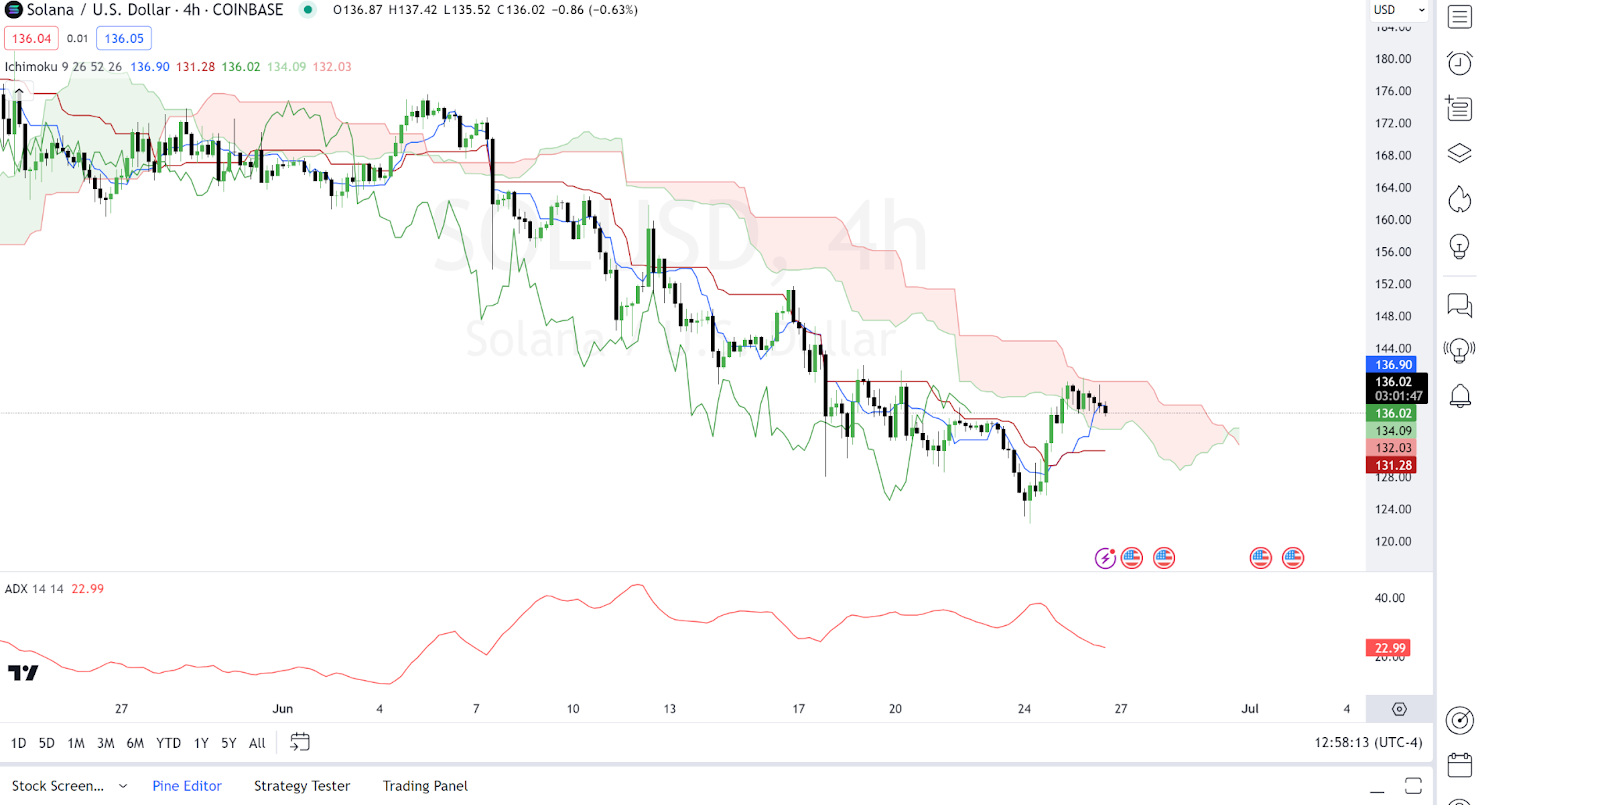
Solana Price Review
As seen from its price movements, Solana (SOL) has also failed to show gains today. An in-depth analysis shows that the *SOL* price below the cloud indicates a clear bearish trend. The Solana price remains subdued under the Ichimoku lines, reinforcing the bearish sentiment.
On the other hand, the Average Directional Index (ADX) is around 23, suggesting a strengthening trend that supports the bearish outlook shown by the Ichimoku Cloud. As of press time, Solana traded at $135.17, representing a 2.2% decrease over the last 24 hours.
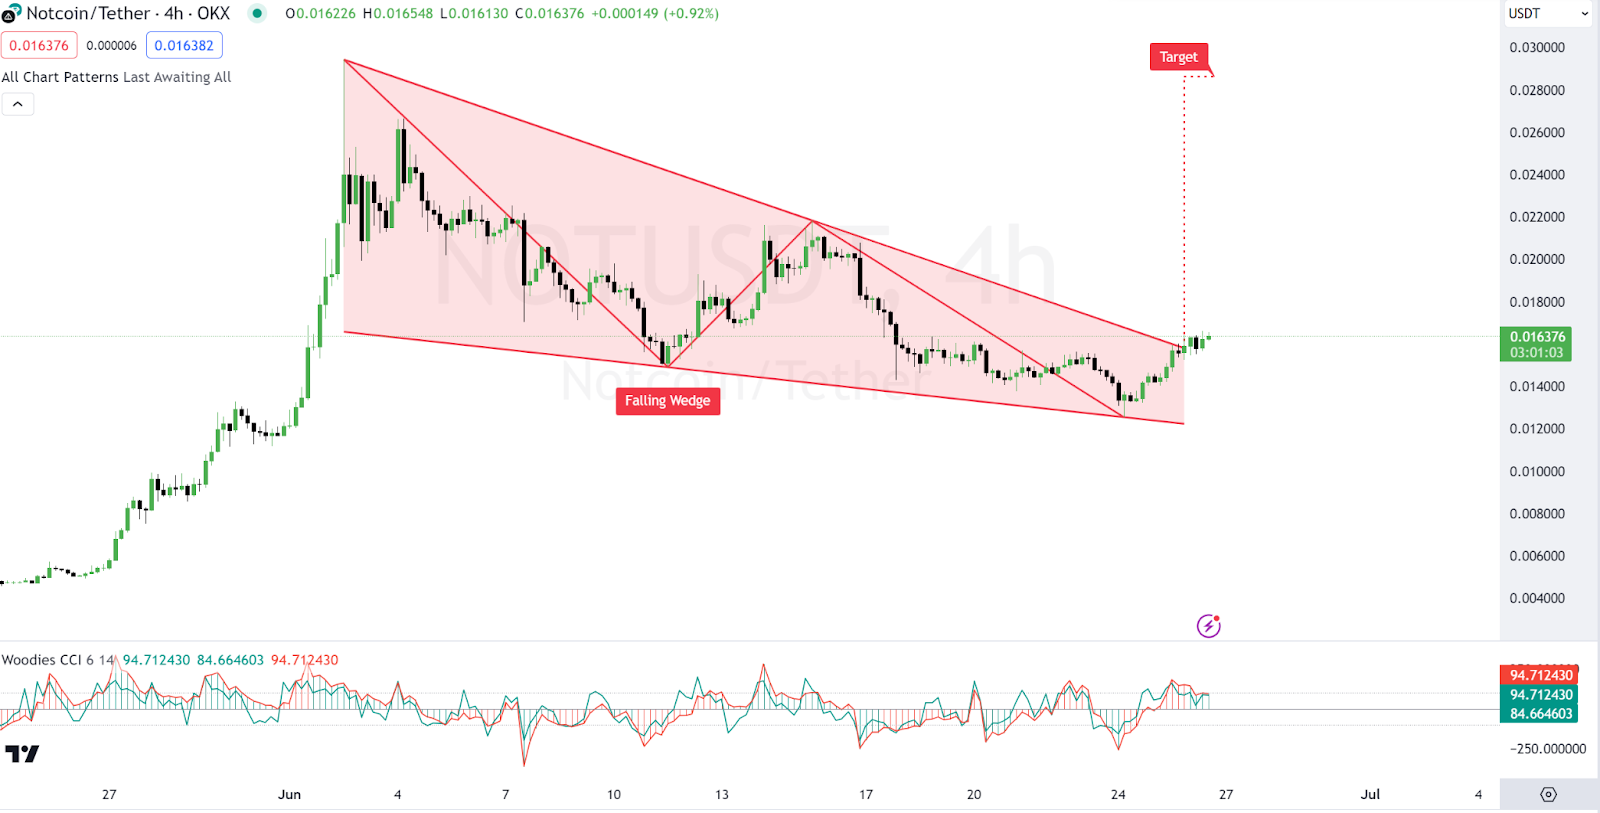
Notcoin Price Review
Notcoin (NOT) is among the few gainers in today’s session, as seen from its price movements. An in-depth analysis shows that the chart displays a Falling Wedge pattern, typically a bullish reversal pattern signaling potential upward price movement upon breakout.
On the other hand, positive spikes on the Woodies CCI as the price breaks out of the wedge suggest strong bullish momentum building, supporting the potential reversal. As of press time, Notcoin traded at $0.01619, representing a 6.6% increase over the last 24 hours.