Near Protocol (NEAR) Faces Price Pressure Amid Network Activity Drop
The last month has been marked by a decline in network activity across the Near (NEAR) protocol. Its daily transaction volume has dropped, causing its network fees and revenue to dip.
This has impacted the protocol’s native token NEAR, which has also witnessed a double-digit decline in value over the last 30 days.
Near Protocol Sees User Exodus
Over the past 30 days, Near has experienced a general decline in demand. The number of unique on-chain interactions with the protocol completed during that period has plunged by 15%. As of June 24, the total number of transactions completed on Near was 7.7 million.
 Near Daily Transactions. Source: Artemis
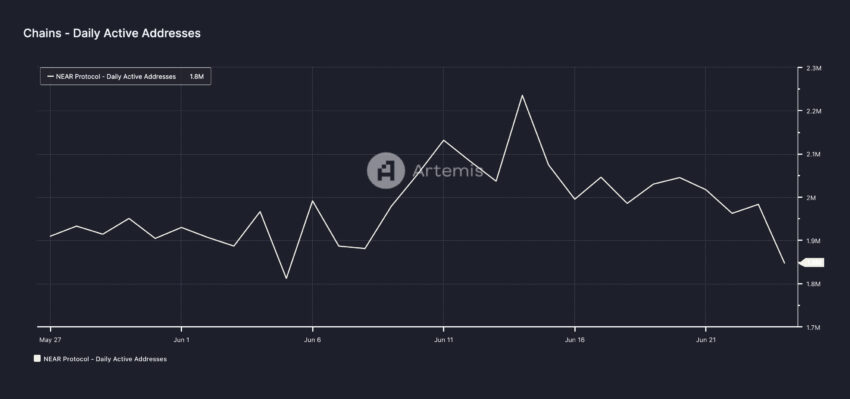
 The decline in daily transaction count on NEAR is due to the fall in the number of unique addresses interacting with the protocol.
Since it peaked at 2.2 million on June 14, Near’s daily active addresses have since plummeted by 18%.
Read More: What Is NEAR Protocol (NEAR)?
 Near Daily Active Addresses. Source: Artemis
 The fall in Near’s demand in the last month has impacted its network fees and revenue. During the period under review, Near’s transaction fees have totaled $24,000, falling by 38%.
From this, a revenue of $23,000 has been obtained, recording a 30% decline.
NEAR Price Prediction: A Shift In Market Trend is Required
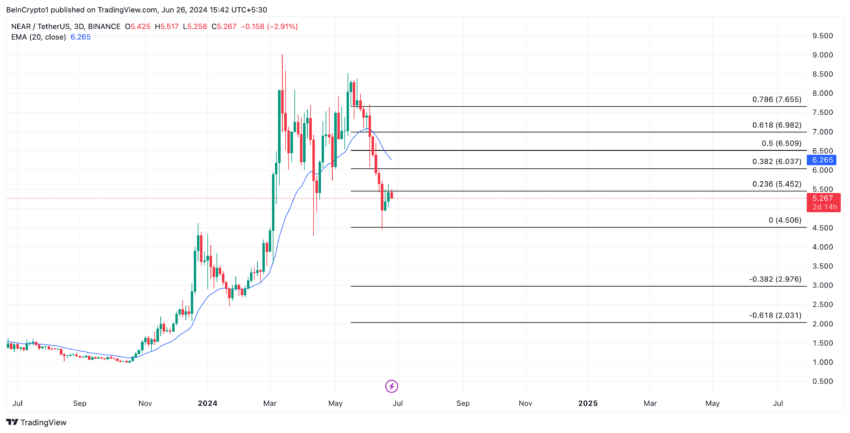
The decline in Near’s network usage over the past 30 days has negatively impacted the performance of its native coin. NEAR trades at $5.27 at press time, and its value has declined by 30% in the past 30 days.
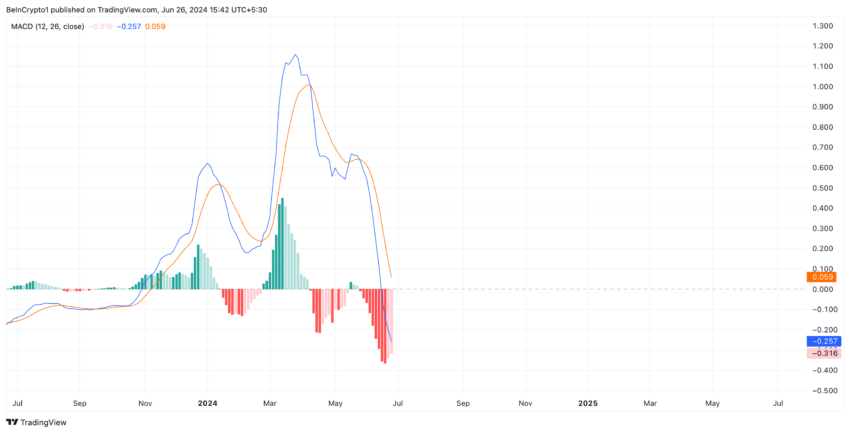
NEAR’s Moving Average Convergence Divergence (MACD) indicator shows a significant bearish bias toward it. At press time, the token’s MACD line (blue) rests under its signal (orange) and zero lines.
 Near Analysis. Source: TradingView
 Traders often use this indicator to identify trends and potential reversals in asset prices. When the MACD line crosses below the signal line, it suggests that the short-term momentum is weaker than the longer-term momentum.
Coin holders interpret this setup as a signal to consider selling or to avoid entering new long positions until there are signs of the MACD line crossing above the signal line and the zero line, which could indicate a potential reversal or a shift in market sentiment.
If sentiment remains bearish, NEAR’s price may plunge further to trade under $5.
Read More: Top 8 NEAR Wallets in 2024
 Near Analysis. Source: TradingView
 However, if buying pressure picks momentum and the trend shifts to bullish, its price may rally to $5.45.


