Polkadot (DOT) Price Needs More Than Hope to Escape Downtrend
Polkadot’s (DOT) price will likely react to the positive shift in investors’ sentiment despite the negative price development.
The chances of a breakout are high, given the altcoin is moving within a descending channel pattern.
Polkadot Holders Are Bullish
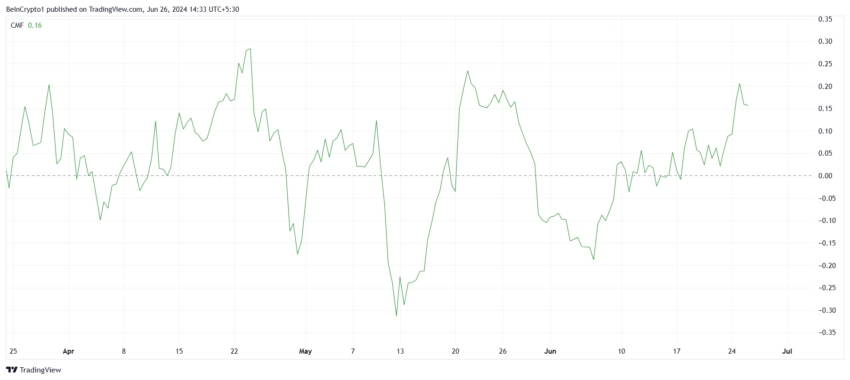
Polkadot’s price could witness the impact of DOT holders changing their tone towards the asset. The evidence of this can be found in the Chaikin Money Flow (CMF), which has entered the positive zone after nearly a month.
This shift indicates a significant surge in buying pressure, suggesting that investors are showing renewed interest in Polkadot.
The positive CMF is a key indicator of market sentiment, highlighting that money is flowing into Polkadot. This influx is often associated with increasing demand and potential upward price movement, making it an essential metric for traders to monitor.
Read More: What Is Polkadot (DOT)?
 Polkadot CMF. Source: TradingView
 In addition to the CMF, Polkadot’s funding rate is also slightly positive, signaling a balance between long and short contracts. This equilibrium indicates that the market sentiment is leaning towards optimism, with a preference for long positions.
The positive funding rate and CMF together suggest that long contracts are currently dominating the market. This dominance could lead to sustained bullish momentum for Polkadot, encouraging more investors to consider long positions.
 Polkadot Funding Rate. Source: Coinglass
 DOT Price Prediction: Short Surge Ahead
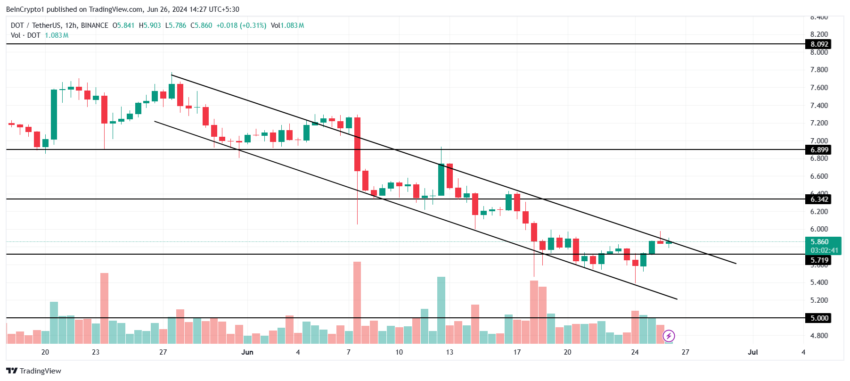
Polkadot’s price is presently moving within a descending channel, attempting a breakout every few days. A descending channel is a chart pattern characterized by a series of lower highs and lower lows. It typically indicates a bearish trend, with prices moving downward between parallel lines.
Based on the pattern, a breakout could send the altcoin rallying by another 6%, pushing it above $6.3. The market supports this outcome, and if DOT manages to leverage it, further growth will be on the cards.
Read More: Polkadot (DOT) Price Prediction 2024/2025/2030
 Polkadot Price Analysis. Source: TradingView
 However, if the breakout fails, Polkadot’s price could end up stuck within this pattern. A drop below $5.7 could send DOT to $5.2 or $5.0, invalidating the bullish thesis.


