Crypto: Ethereum’s Momentum Continues to Decline! Analysis of June 26, 2024
After reaching a peak, Ethereum is experiencing increasingly threatening selling pressure. Let’s examine the future prospects for ETH together.

Current State of Ethereum (ETH)
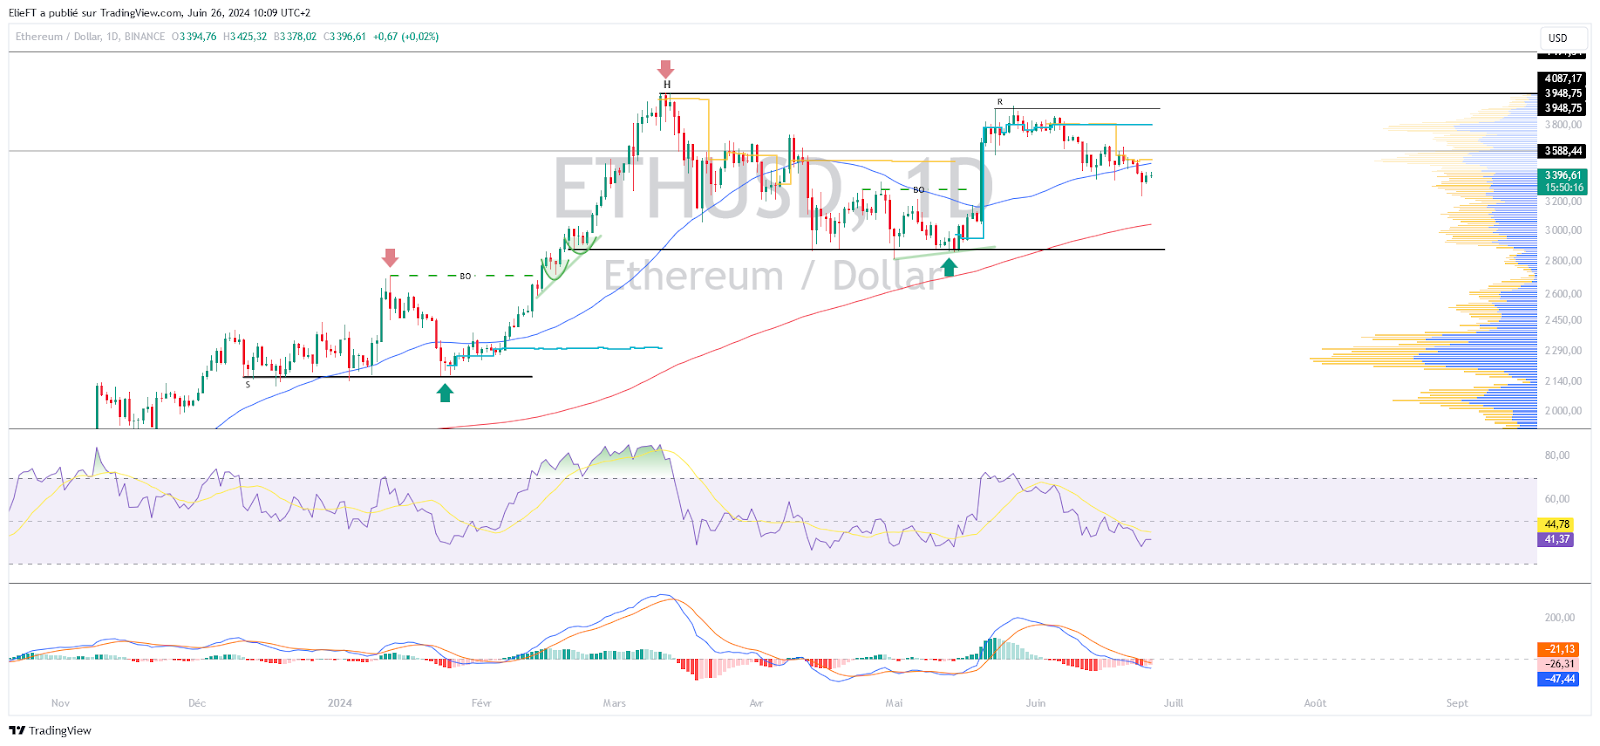
After reaching a peak at $3,950 following the approval of Ethereum spot ETFs, Ethereum’s price has faced selling pressure that naturally pushed the cryptocurrency’s price down. This decline has been fueled by the drop in Bitcoin, which has dragged the whole crypto market with it. Thus, Ethereum is in a short-term downtrend. Nevertheless, it seems to have attracted buying interest at $3,250, which has allowed it to stay above $3,300, a price level highlighted in the June 12 analysis. This leaves hope for a potential rebound countering this selling pressure.
Ethereum is now just below its 50-day moving average. This is not reassuring for the medium/long-term structure of the crypto. However, we can be reassured by the fact that it remains above its 200-day moving average. Regarding the price dynamics of Ethereum, it is no surprise that it continues to drop, as evidenced by the oscillators and Ethereum’s price itself. While this can be an opportune signal in an upward trend, it can become concerning as this decline intensifies.
The current technical analysis was conducted in collaboration with Elie FT, an investor and passionate trader in the cryptocurrency market. Today, he is an instructor at Family Trading, a community of thousands of active proprietary traders since 2017. You’ll find Lives, educational content, and support around financial markets in a professional and friendly environment.
A Closer Look at Derivatives (ETH/USDT)
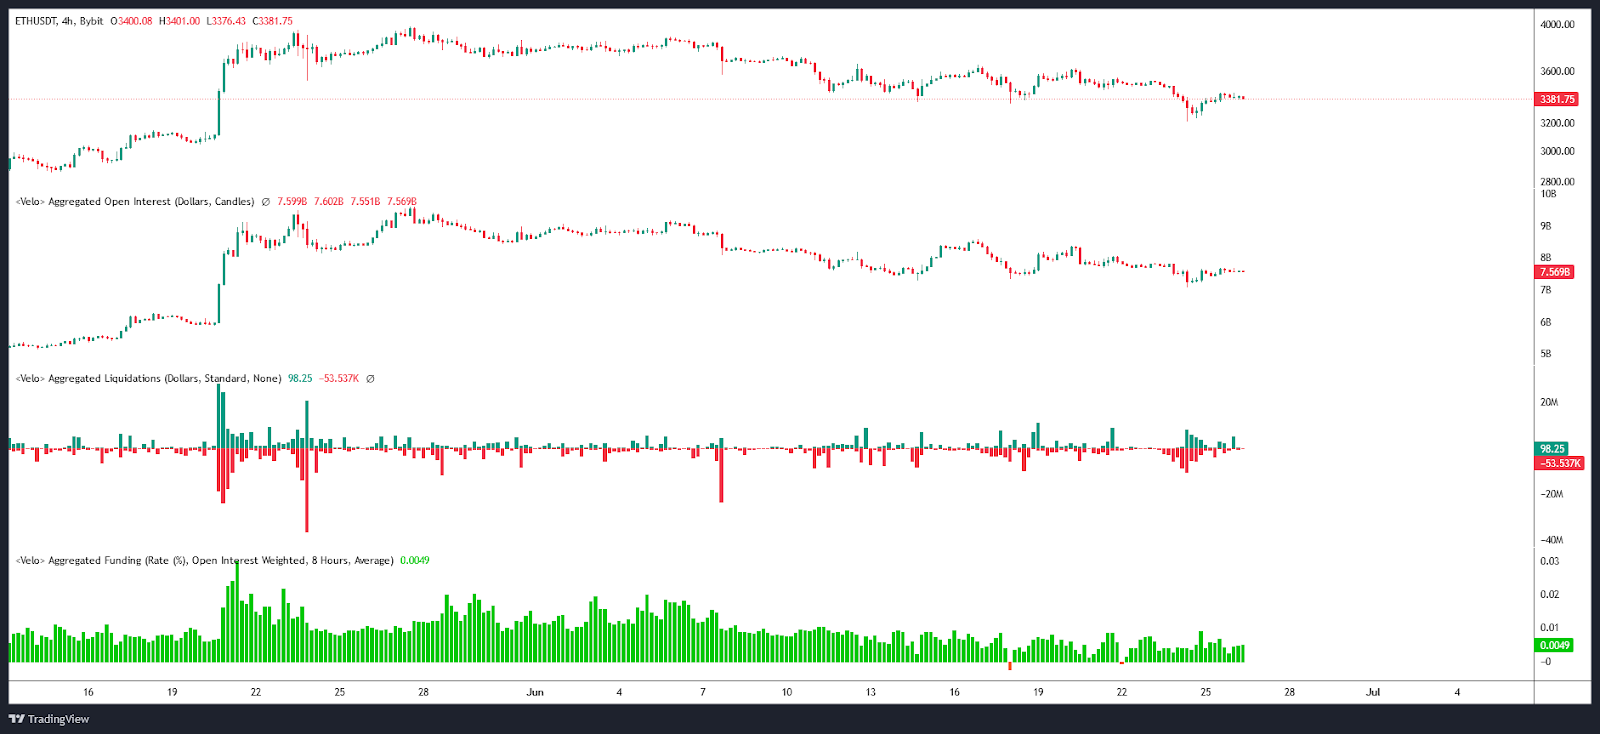
The open interest in Ethereum perpetual contracts seems to have followed the trajectory of the crypto price. This demonstrates an exit of positions by speculators as ETH’s price declines. This phenomenon can be explained by a capitulation of buyers, subtly illustrated by the latest predominantly buying liquidations. Coupled with a continuous drop in funding rates, this demonstrates increasing selling pressure on ETH/USDT contracts. Naturally, this is not convincing from a buyer’s perspective.
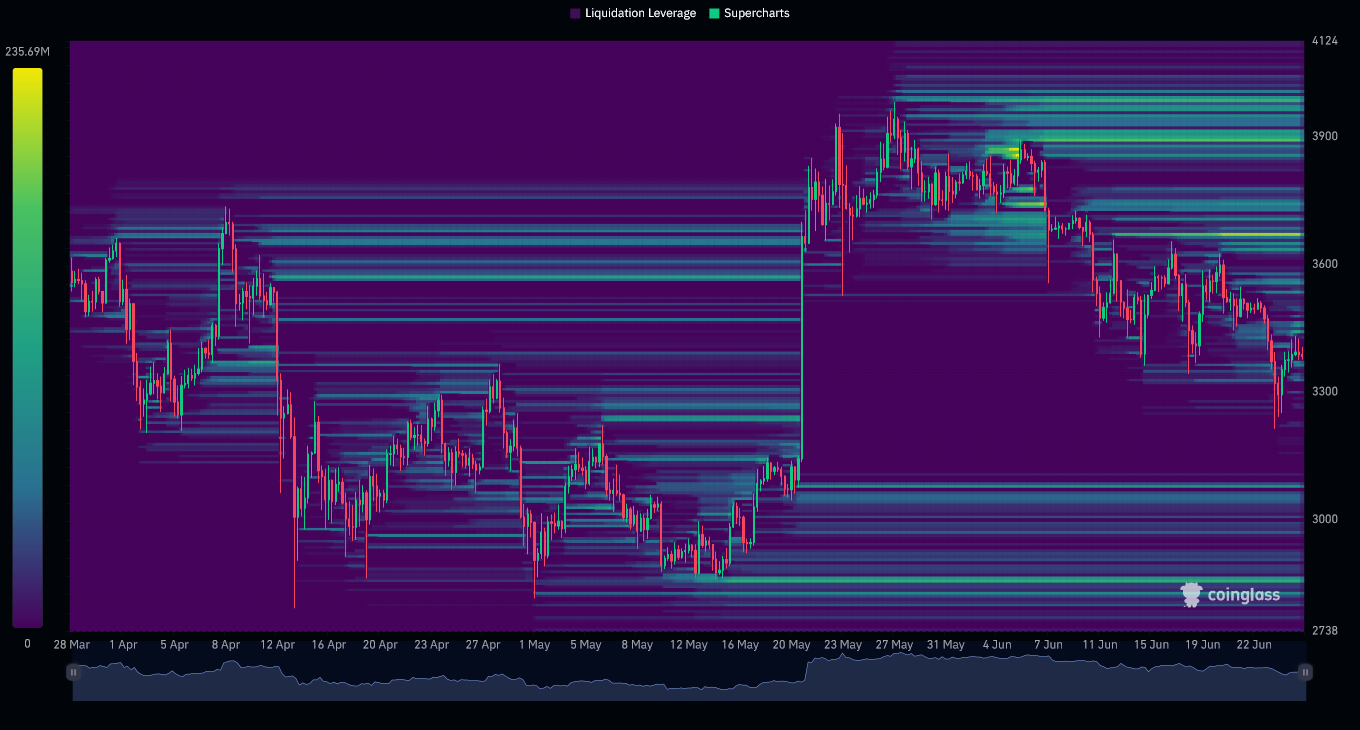
The liquidation heatmap of ETH/USDT over three months reveals that the contact of the last two liquidation zones with Ethereum’s price did not trigger sustained buying interest. Currently, the most significant liquidation zones in recent months are above the current ETH price. Notably, the zone just below $3,700 and the still visible one around $3,900. Below the current price, the significant zone is just below $3,100, extending down to $2,800, where it appears more pronounced. Price approaching these levels could trigger massive order executions, increasing the risk of heightened volatility for Ethereum. These zones thus represent critical interest points for investors.
Hypotheses for Ethereum (ETH) Price
- If Ethereum’s price holds above $3,250, we could anticipate a bullish recovery to $3,500, or even $3,800. The next resistance to consider would then be $4,000 – $4,100. If the upward movement continues, this could mark a new peak at $4,500, opening the path to reaching Ethereum’s ATH. At this point, it would represent an increase of over 32%.
- If Ethereum’s price fails to hold above $3,250, we could foresee a return around $3,000. The next support to consider, if the bearish movement continues, would be in a price range between $2,900 and $2,800. Lower down, we can note the support at $2,700. At this stage, it would represent a decline of around 20%.
Conclusion
Ethereum is currently going through a decline influenced by the crypto market crash. Despite this selling pressure, key support has maintained a certain price level, providing hope for a potential rebound. However, the situation remains uncertain, with ETH’s bearish dynamic persisting, which could become concerning if this trend continues. Thus, it will be crucial to closely observe the price reaction at different key levels to confirm or invalidate current hypotheses. It’s also important to stay vigilant against potential market “fake outs” and “squeezes” in each scenario. Lastly, remember that these analyses are based solely on technical criteria and that cryptocurrency prices can also rapidly evolve based on other more fundamental factors.