Pendle price prediction 2024-2030: Is PENDLE a good investment?
Key takeaways
- Pendle is expected to reach a minimum level of $8.14 in 2024.
- In 2027 the price of Pendle is predicted to reach a maximum level of $29.32.
- $PENDLE price could reach a maximum possible level of $88.70 and an average forecast price of $73.69.
Pendle (PENDLE) is innovating the DeFi space by enabling the trading of future yields. This unique approach helps users maximize returns through advanced smart contracts and seamless integration with other DeFi platforms.
The recent progress of Pendle such as smart contract updates, and strategic partnerships marks its growth and commitment to innovation. Will these developments increase the value of $PENDLE? How will market changes and regulations affect its growth? Can Pendle reach $10?
Overview
| Cryptocurrency | Pendle |
| Token | PENDLE |
| Price | $5.52 |
| Market Cap | $936,427,481 |
| Trading Volume | $111,492,807 |
| Circulating Supply | 155,295,699 |
| All-time High | $7.52 Apr 11, 2024 |
| All-time Low | $0.03349 Nov 09, 2022 |
| 24-h High | $5.89 |
| 24-h Low | $5.51 |
Pendle price prediction: Technical analysis
| Metric | Value |
| Price Prediction | $ 18.89 (230.91%) |
| Volatility | 8.48% |
| 50-day SMA | $5.54 |
| 14-Day RSI | 55.17 |
| Sentiment | Bearish |
| Fear & Greed Index | 46 (Fear) |
| Green Days | 13/30 (43%) |
| 200-Day SMA | $3.64 |
Pendle price analysis: Pendle experiences bearish market with declining to $5.52
TL;DR Breakdown
- Pendle’s price shows a downward trend.
- Resistance for PENDLE is currently at $5.89.
- Support for the token is trading at $5.51.
Pendle price analysis shows a declining trend, with the price decreasing from $5.88 to $5.52. Despite minor fluctuations, the overall trajectory is downward, indicating a bearish market sentiment. This downward trend suggests a higher selling pressure compared to buying interest, which has led to the observed decrease in price.
Pendle 1-day price analysis: Price movement is anticipated to stay negative
The 1-day Pendle price analysis has experienced some selling pressure around the $5.52 level in the past 24 hours, and this could indicate that the market sentiment is still bearish. The PENDLE price shows a strong bearish trend for the market today, as the price covered a downward movement in the past 24 hours.
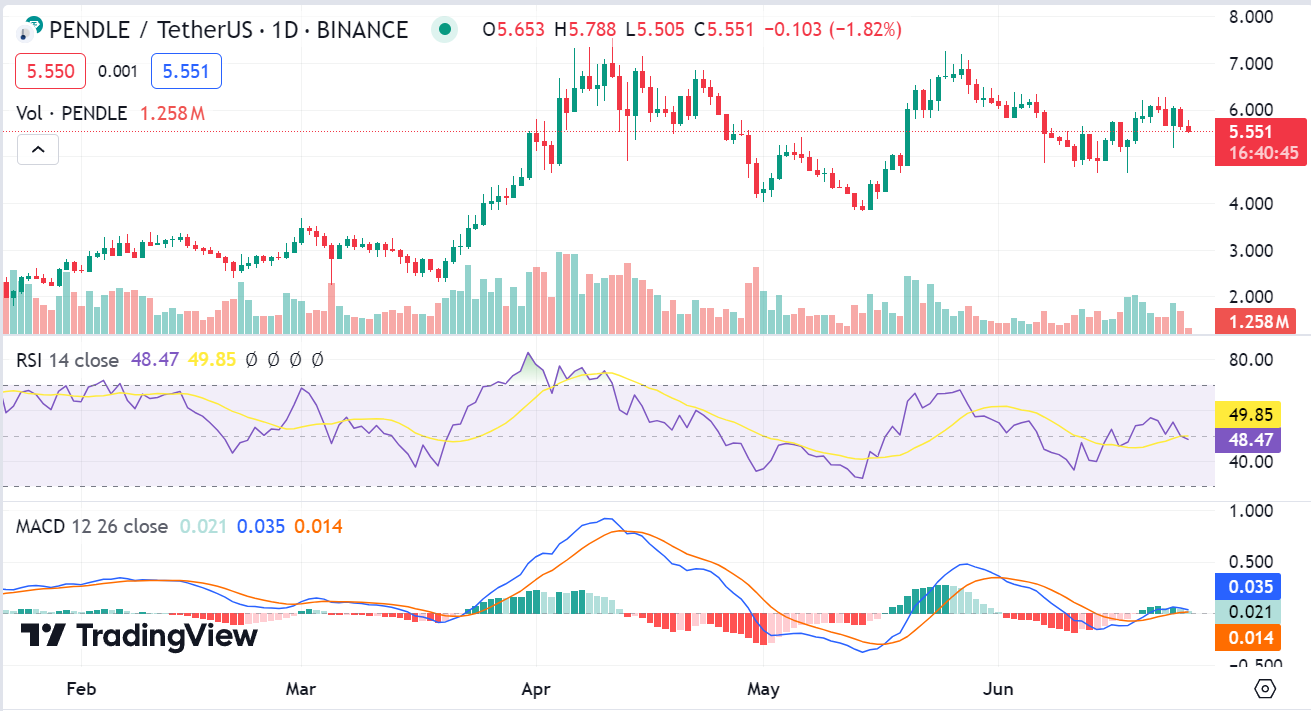
PENDLE/USD 1-day price chart; TradingView
The Moving Average Convergence Divergence (MACD) shows a slight positive divergence with the MACD line at 0.021 above the signal line at 0.014, indicating potential bullish momentum. The Relative Strength Index (RSI) is at 48.47, indicating a neutral zone, suggesting a balance between buying and selling pressures.
Pendle 4-hour price chart: Pendle faces bearish sentiment amidst consolidation phase
The hourly price chart of Pendle shows a notable volatility within the $5.50 to $5.65 range. After a brief rise to $5.65, the price dipped to $5.52, followed by a recovery attempt that failed to break above $5.65. The trading volume was moderate, indicating a lack of strong momentum in either direction.
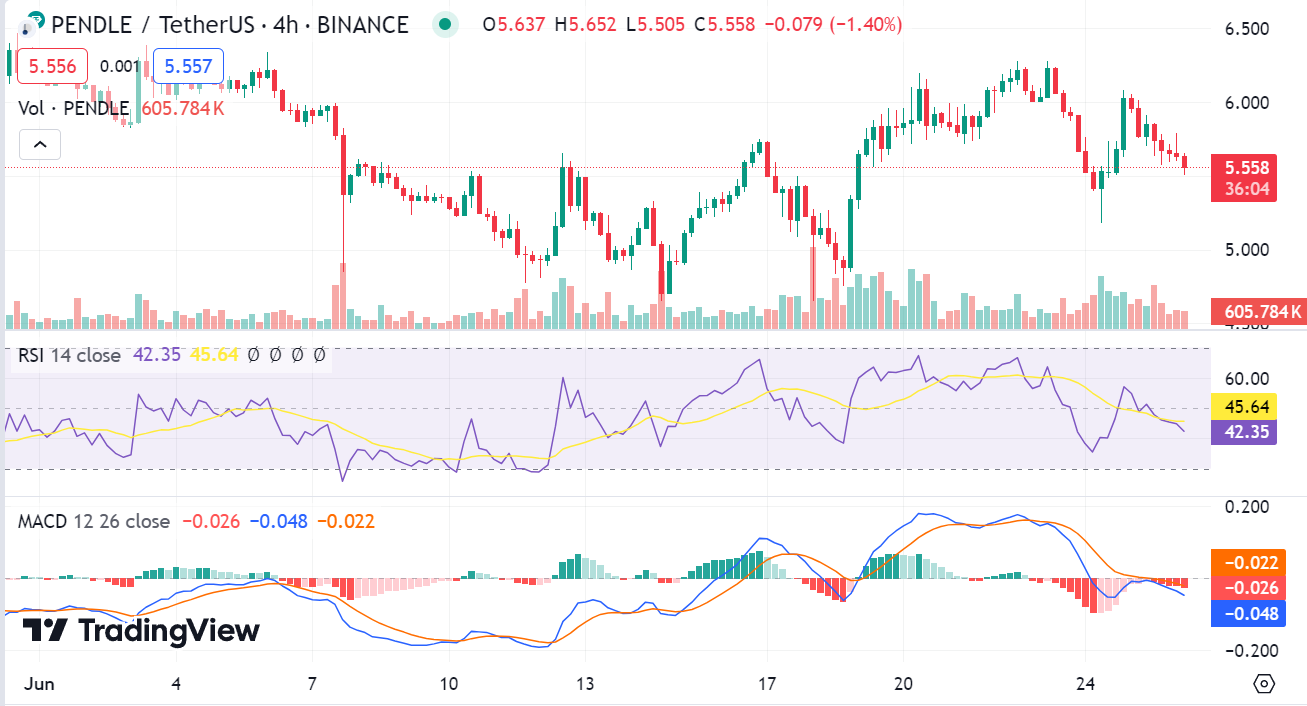
PENDLE/USD 4-hour price chart; TradingView
The MACD indicator shows a bearish crossover, with the MACD line (-0.026) crossing below the signal line (-0.022), further confirming the bearish trend. The histogram is also negative, indicating that downward momentum might continue in the short term. The RSI indicator on the hourly chart is currently at 42.35, indicating that the market is neither oversold nor overbought.
Pendle technical indicators: Levels and action
Daily simple moving average (SMA)
| Period | Value ($) | Action |
| SMA 3 | 5.70 | SELL |
| SMA 5 | 5.63 | SELL |
| SMA 10 | 5.44 | SELL |
| SMA 21 | 5.43 | BUY |
| SMA 50 | 5.44 | BUY |
| SMA 100 | 5.13 | BUY |
| SMA 200 | 3.55 | BUY |
Daily exponential moving average (EMA)
| Period | Value ($) | Action |
| EMA 3 | 5.66 | SELL |
| EMA 5 | 5.84 | SELL |
| EMA 10 | 6.00 | SELL |
| EMA 21 | 5.85 | SELL |
| EMA 50 | 5.47 | BUY |
| EMA 100 | 4.82 | BUY |
| EMA 200 | 3.75 | BUY |
Pendle price analysis conclusion
Pendle price analysis confirms that the market sentiment for the token is still bearish, and it doesn’t look likely that the coin will be able to break above the $5.89 resistance level anytime soon. The technical indicators also suggest that bears are still in control of the price action and that any upside momentum could be capped around this level.
Is PENDLE a good investment?
Investing in Pendle coin offers a unique opportunity in the DeFi sector. Pendle’s approach to tokenizing and trading future yields allows for flexible management of yield-bearing assets, enhancing investment portfolios.
Pendle’s ecosystem shows strong community trust, with impressive TVL, market cap growth, and endorsements from industry veterans like Arthur Hayes. These factors, along with high yields, make Pendle a compelling investment in innovative DeFi projects.
Recent news/opinion on Pendle
- Arthur Hayes purchases 92,339.6 $PENDLE through Wintermute’s algorithm trading platform.
Pendle price prediction June 2024
Pendle could experience an uptrend in June, surpassing $8.26 at the end of the month. The minimum price projected for the token is around $5.96. On average, traders and investors can expect $PENDLE to trade at $6.12.
| Pendle price prediction | Potential Low | Average Price | Potential High |
| Pendle price prediction June 2024 | $5.96 | $6.12 | $8.26 |
Pendle Price Prediction 2024
The price of Pendle is expected to reach at a minimum level of $8.14 in 2024. The $PENDLE price can reach a further maximum price level of $9.50 with the average price of $8.47 throughout 2024.
| Pendle Price Prediction | Potential Low | Average Price | Potential High |
| Pendle price prediction 2024 | $8.14 | $8.47 | $9.50 |
Pendle price prediction 2025-2030
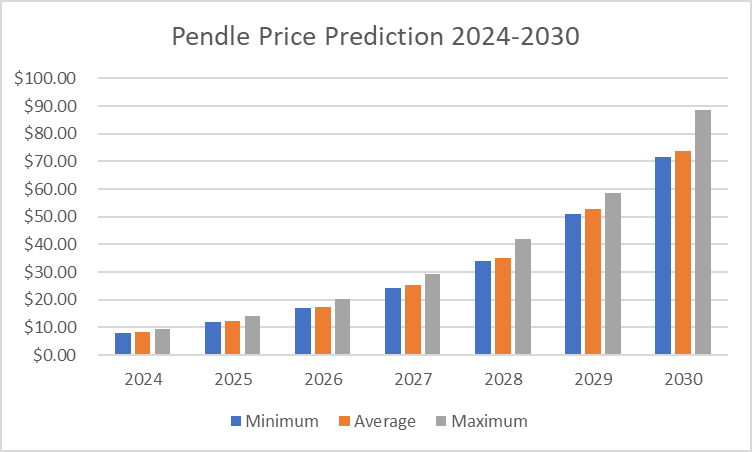
| Year | Minimum Price | Average Price | Maximum Price |
| 2025 | $11.84 | $12.18 | $14.22 |
| 2026 | $16.87 | $17.36 | $20.43 |
| 2027 | $24.35 | $25.22 | $29.31 |
| 2028 | $33.98 | $35.24 | $42.04 |
| 2029 | $50.96 | $52.72 | $58.43 |
| 2030 | $71.58 | $73.69 | $88.70 |
Pendle Price Prediction 2025
The price of Pendle is predicted to reach a minimum value of $11.84 in 2025. $PENDLE could reach a maximum value of $14.22 and an average trading price of $12.18.
Pendle Price Prediction 2026
In 2026 the price of Pendle is predicted to reach a minimum level of $16.87. $PENDLE’s price can reach a maximum level of $20.43 and an average trading price target of $17.36.
Pendle Price Prediction 2027
In 2027, the average price of Pendle is predicted to reach a minimum level of $24.35. $PENDLE’s price can attain a maximum level of $29.31 and an average trading price of $25.22.
Pendle Price Prediction 2028
The PENDLE price prediction for 2028 projects a minimum price of $33.98 for the token. As per analyst forecast, the token could reach a maximum price of $42.04 and an average trading price of $35.24.
Pendle Price Prediction 2029
The price of Pendle is predicted to reach a minimum value of $50.96 in 2029. Per the predictions, holders can expect a maximum price of $58.43 and an average trading price of $52.72.
Pendle Price Prediction 2030
The Pendle price forecast for 2030 projects a minimum price of $71.58, a maximum price of $88.70 and an average forecast price of $73.69.
Pendle market price prediction: Analysts’ $PENDLE price forecast
| Firm | 2024 | 2025 |
| Coindex | $7.76 | $19.45 |
| DigitalCoinPrice | $13.07 | $15.06 |
| CryptoPredictions | $6.21 | $12.39 |
Cryptopolitan’s $PENDLE price prediction
According to our Pendle price forecast, the coin’s market price might reach a maximum value of $9.50 by the end of 2024. Looking forward to 2026, the value of Pendle could surge to a new all-time high (ATH) of $15.
Pendle historic price sentiment

- In September 2020, the price of Pendle started around $1.0849 and saw a gradual decline.
- Between October and December 2020, the price continued to decrease steadily, ending the year below the $1.0 mark.
- Between January and June 2021, the price remained relatively stable, fluctuating around the $0.90 to $1.0 range.
- Between July and December 2021, Pendle continued to exhibit minor fluctuations, maintaining a range around the $1.0 mark but showing no significant upward or downward trend.
- The price of Pendle Jan-Dec 2022, remained relatively flat, hovering around the $1.0849 mark with minimal fluctuations. There was little to no significant upward or downward movement during this period.
- In June 2023, the price continued to remain stable, with slight declines observed but staying well below the $1.0 mark. The price did not show any significant upward momentum and maintained a steady range.
- Starting from mid-2023, the price began to show slight upward movements, though it was still relatively low.
- By the end of December 2023, the price showed some initial signs of increase, moving closer to the $1.2 mark.
- $PENDLE saw significant growth in Q1 2024, hitting above $2.5 in January 2024, $3.2 in February, and $5.5 by the end of March.
- The positive momentum from Q1 2024 continued in Q2 2024. $PENDLE attained its ATH ($7.52) on April 11, 2024. The token retested its support at around $3.8 in mid-May but soon rebounded above $7 on May 20.
- $PENDLE closed in May at $6.8 and in June 2024, the token is trading within the $4.6 – $6.3 range.