BRETT Futures Open Interest Climbs to Multi-Month Highs
Brett (BRETT), also known as Pepe’s best friend on the Base Chain, has seen its price surge by three digits over the past 30 days.
At press time, the altcoin trades at $0.15, having recorded a 253% price hike in the last month.
Brett’s Futures Traders “Ape In”
The uptick in BRETT’s price in the last month has led to a surge in its futures market activity. This can be gleaned from its rising futures open interest.
As of this writing, the altcoin’s futures open interest is $37 million. This represents its highest level since the token launched in February.
 Brett Open Interest. Source: Coinglass
 Futures open interest refers to the total number of outstanding futures contracts that have not been closed or settled.
When it spikes, it indicates that more traders are entering the market. This heightened activity can lead to greater liquidity, making it easier to execute large trades without significantly impacting the price.
A positive funding rate has accompanied BRETT’s rising futures open interest. On-chain data shows that BRETT’s funding rate was last negative on May 4. It has since returned only positive values. As of this writing, BRETT’s funding rate is 0.01%.
Read More: 7 Best Base Chain Meme Coins to Watch in June 2024
 Brett Funding Rate. Source: Coinglass
 The funding rate is a mechanism that helps to ensure that the contract price remains close to the underlying asset’s spot price. It tracks the periodic payments made between traders who hold long and short positions in perpetual futures contracts.
When its value is positive, it is a bullish signal. This means there is greater demand for long-term positions than short-term ones.
BRETT Price Prediction: Will it Reclaim its All-Time High?
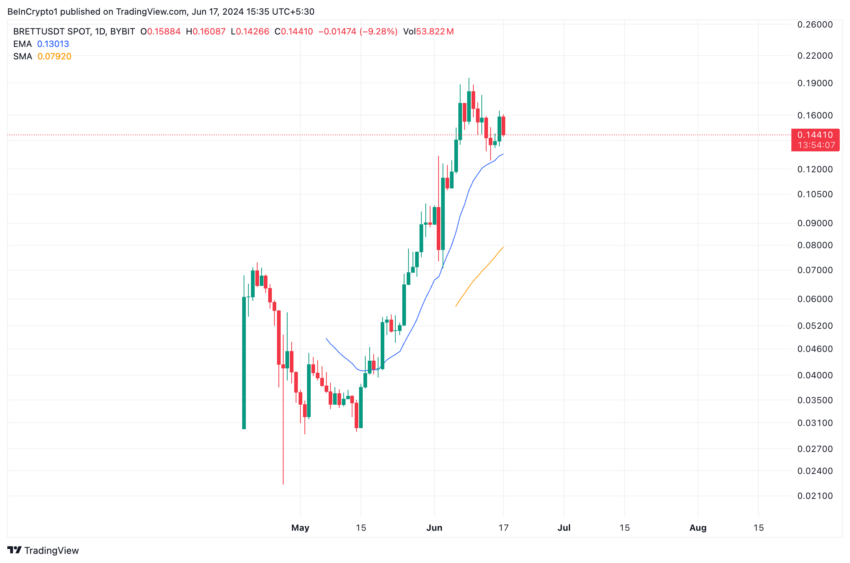
At its current price of $0.15, BRETT trades above its key moving averages. The token’s price rests above its 20-day exponential moving average (EMA) and 50-day small moving average (SMA).
 Brett Analysis. Source: TradingView
 An asset’s 20-day EMA tracks its average price in the past 20 days, while its 50-day SMA tracks the average of its closing prices over the last 50 days.
When an asset trades above both the 20-day EMA and the 50-day SMA, it generally indicates strong bullish momentum and a healthy uptrend in both the short and medium term.
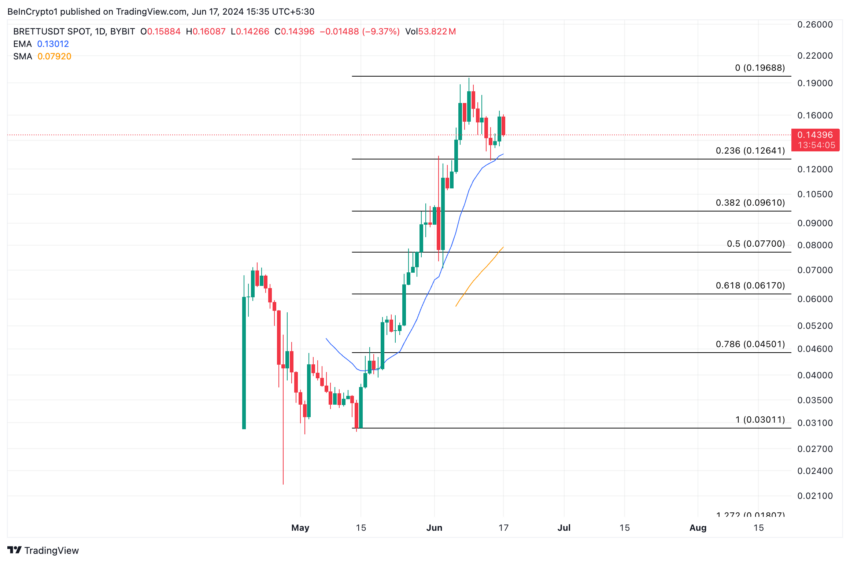
If this trend continues, BRETT might rally to reclaim its June 9 all-time high of $0.19.
 Brett Analysis. Source: TradingView
 However, if selling pressure skyrockets and traders begin to take profit, the altcoin’s value might drop to $0.12.


