Bitcoin Struggles to Break Past $67,000 Resistance, Eyes New Support Levels
- Bitcoin faces difficulty in breaching the $67,000 resistance zone.
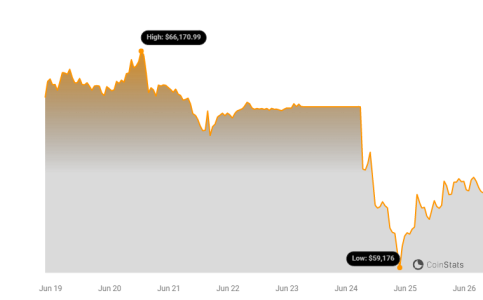
- The cryptocurrency stayed within a risky price range, starting a decline from $66,868.
- Noteworthy information reveals BTC/USD pair experienced a crucial break below the support level, detecting near-term movement trends.
Get the latest insights on Bitcoin’s struggle with resistance levels and potential market movements.
Bitcoin Encounters Strong Resistance at $67,000
Bitcoin, one of the leading cryptocurrencies, has encountered significant resistance trying to surpass the $67,000 level. This price behavior indicates a strong selling interest at this level, causing BTC to retrace and test lower price points. The BTC/USD pair broke below the $66,500 support level, indicating possible further declines. According to recent charts, Bitcoin is currently trading around $66,800, suggesting a potential test of the 50% Fib retracement level from a previous rise from $65,075 to $66,868.
Price Movements and Key Resistance Levels
On the upside, Bitcoin faces resistance near the $66,500 mark, closely followed by the 100-hour simple moving average (SMA). The next significant hurdle for BTC lies at the $66,850 level, with a potential breakout point at $67,000. A clear movement above this resistance could initiate a substantial upward trend, driving the price higher.
Nevertheless, should Bitcoin fail to climb above the $66,500 resistance, it may continue its downward trajectory. Crucial support seems to be forming around the $65,750 level, with secondary support near $65,500. Increased selling pressure might push Bitcoin’s price towards the $65,000 support zone in the near term.
Technical Indicators Reflect Bearish Sentiment
The short-term technical indicators for Bitcoin show a bearish outlook. The MACD (Moving Average Convergence Divergence) on the hourly chart is gaining momentum in the bearish zone, affirming a growing sell signal. Similarly, the RSI (Relative Strength Index) for BTC/USD is currently below the 50 level, suggesting that sellers have the upper hand in the market.
Analyzing Market Support and Resistance Levels
Given the current scenario, observing the significant support and resistance levels is crucial for investors and traders. The primary support levels to watch are $66.500 and subsequently $65,000. On the resistance side, Bitcoin needs to overcome $66,500 and $67,000 to initiate a robust bullish momentum. Traders are advised to keep a close eye on these levels and employ suitable risk management strategies when executing trades.
Conclusion
In summary, Bitcoin is hovering around a critical resistance zone at $67,000. With a strong selling interest emerging at this level, the cryptocurrency might face increased volatility in the near term. Investors should remain cautious and monitor key technical indicators to make informed decisions. As always, conducting thorough research and being aware of the inherent risks in cryptocurrency trading is essential for navigating the market effectively.