Bitcoin Cash (BCH) Rises Bullishly with Strong On-Chain Data Support
Bitcoin Cash (BCH) is currently riding a bullish wave, but a drop below the daily Ichimoku cloud could signal a shift to a bearish trend.
Investors should keep a close eye on key support and resistance levels to navigate potential market changes.
Technical Outlook for Bitcoin Cash
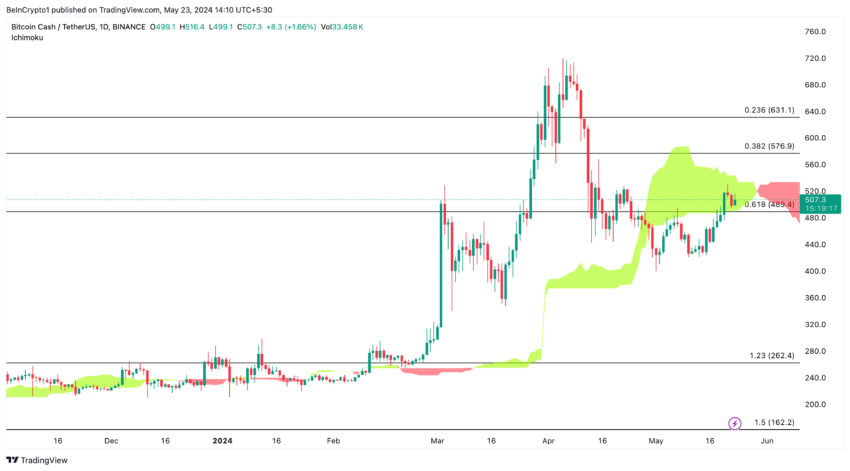
Bitcoin Cash (BCH) is currently trading at $507 inside the daily Ichimoku cloud. Exiting the daily Ichimoku cloud to the downside could reverse the bearish trend.
 BCH/USDT (1D). Source: TradingView
 A successful break above it could signal further bullish momentum.
Key Fibonacci resistance levels to watch include the 0.382 level at $576.9, the 0.236 level at $631.1, and the 0.618 level at $489.4, which acts as critical support.
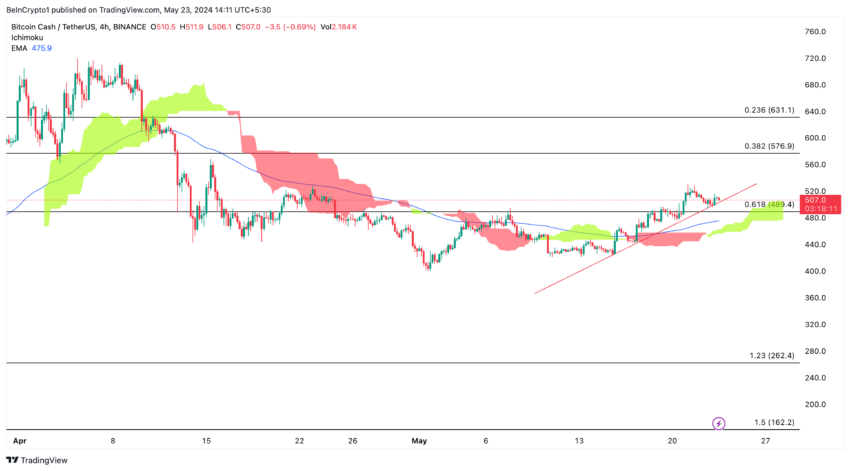
On the 4-hour timeframe, BCH is trading above the Ichimoku cloud, indicating a short-term bullish trend.
Read More: How To Buy Bitcoin Cash (BCH) and Everything You Need To Know
 BCH/USDT (4H). Source: TradingView
 The price is currently hovering around the 0.618 Fibonacci level at $489.4, which acts as support. The 100-period Exponential Moving Average (EMA) at $475.9 also provides support, reinforcing the bullish outlook.
The Ichimoku Cloud is a tool used in technical analysis to help identify trends in the market. Here’s a simple breakdown:
Cloud: The shaded area on the chart shows potential support and resistance levels.
When the price is above the cloud, it suggests an upward trend (bullish). When the price is below the cloud, it suggests a downward trend (bearish).
Lines: There are several lines in the Ichimoku Cloud:
Conversion Line (Tenkan): Shows the average price over the last 9 periods (candles).
Base Line (Kijun): Shows the average price over the last 26 periods (candles).
Leading Span A and B: These form the cloud and project future support and resistance levels.
BCH Analysis: Demystifying On-Chain Data Insights
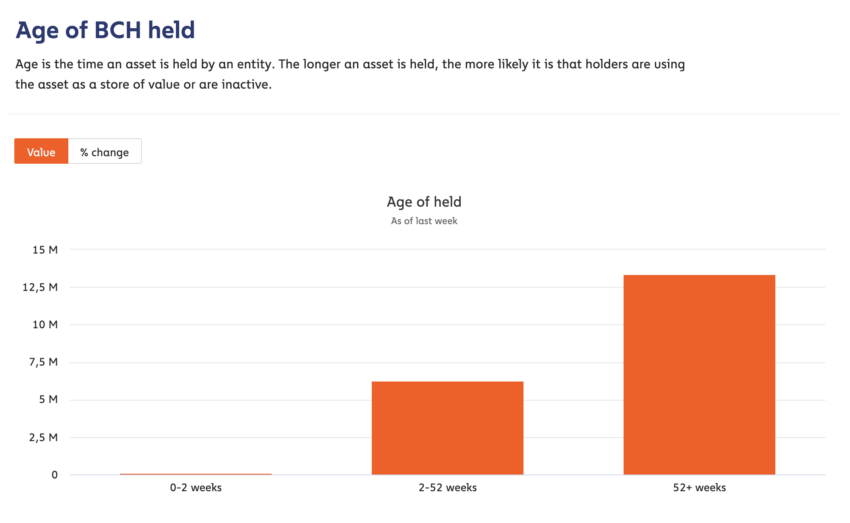
Investors hold the majority of BCH, approximately 13 million coins, for over 52 weeks, showing strong long-term confidence. This indicates that a significant portion of the supply is held by investors who believe in BCH’s long-term potential, reducing selling pressure and providing price stability.
Around 6 million BCH are held for 2-52 weeks, indicating medium-term holders who may be waiting for further price appreciation before considering selling.
 Age of BCH Held. Source: Chainalysis
 This group boosts overall holding power, reducing volatility and increasing the potential for a sustained upward trend. Less than 700K BCH are held for 0-2 weeks, showing minimal activity from short-term holders.
Read More: Bitcoin Cash (BCH) Price Prediction 2024/2025/2030
This indicates low speculative trading, a positive sign for market stability, as it suggests fewer sudden sell-offs and more consistent price action driven by longer-term investors.
Strategic Recommendations: Bullish to Neutral Outlook
Monitor Key Resistance and Support Levels: Watch the $516.4 resistance level for potential bullish breakthroughs, and ensure BCH holds above the $489.4 and $475.9 critical support levels to maintain the positive outlook.
Bitcoin Cash (BCH) is currently within the daily Ichimoku cloud, facing a key resistance level at $516.4. A downside exit from the daily Ichimoku cloud could invalidate the bullish outlook.


