Daily Market Review: BTC, ETH, KAS, WIF, PEPE
Today’s market session has bears on the front foot, as seen from the increase in the global market cap over the last day. The total cap stood at $2.6T as of press time, representing a 0.57% decrease in the previous 24 hours, while the trading volume stood at $99.77B, representing a 40.49% decrease.
Bitcoin Price Review
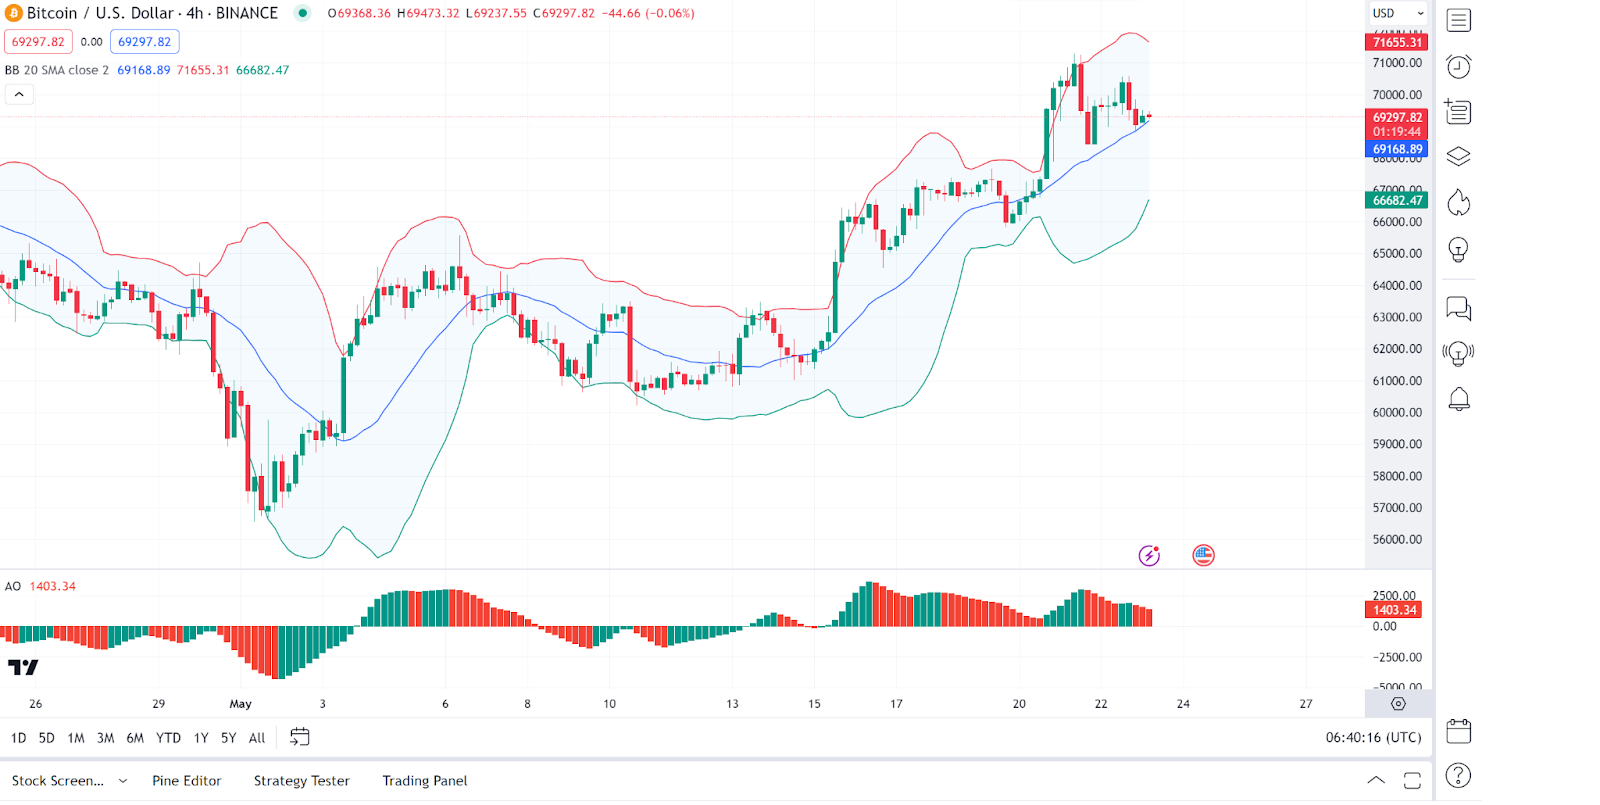
Bitcoin (BTC) is consolidating today’s session as evidenced by its price movements. An in-depth analysis shows that the Bollinger Bands are widening, indicating increased market volatility. The recent bearish candlestick formation close to the lower band could signal a potential reversal or further decline.
The Awesome Oscillator, shown at the bottom of the chart, displays a trend of red bars decreasing in length. This indicates that the bullish momentum is weakening. As of press time, the Bitcoin price stood at $69,589, a 0.32% decrease in valuation over the last 24 hours.
Ethereum Price Review
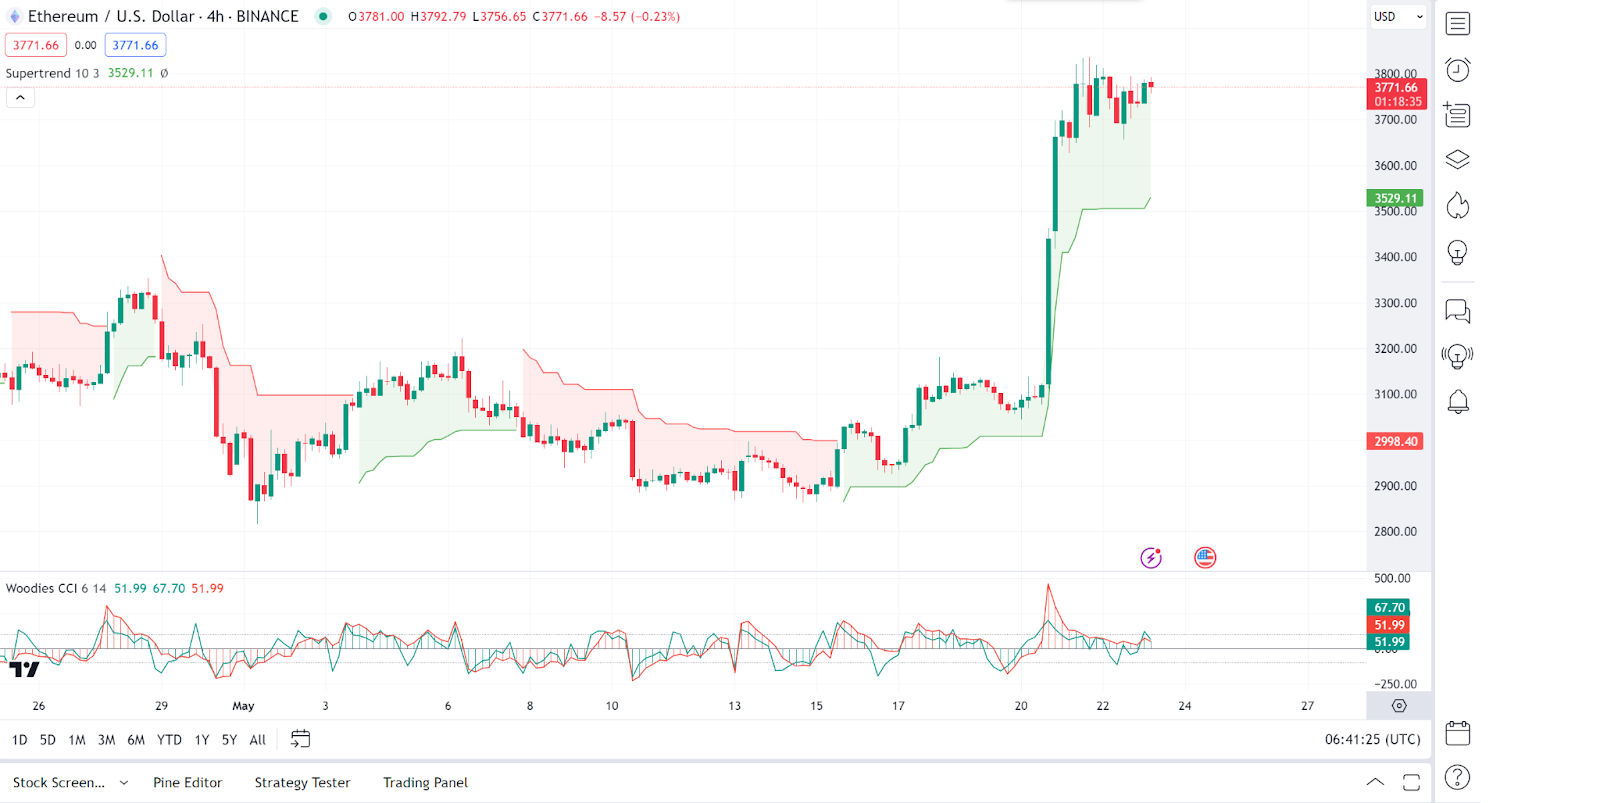
However, Ethereum (ETH) has posted a few gains in today’s session, as evidenced by its price movements. An in-depth analysis shows that Ethereum has seen a significant bullish surge, breaking past the super trend indicator’s resistance, which now acts as support. The super trend has turned green, indicating a strong bullish phase.
On the other hand, the Relative Strength Index (RSI) isn’t shown but would likely indicate overbought conditions given the steep ascent. However, the Woodies CCI oscillates around zero, showing a weak trend. As of press time, the Ethereum price stood at $3,784, a 0.6% increase in valuation over the last 24 hours.
Kaspa Price Review
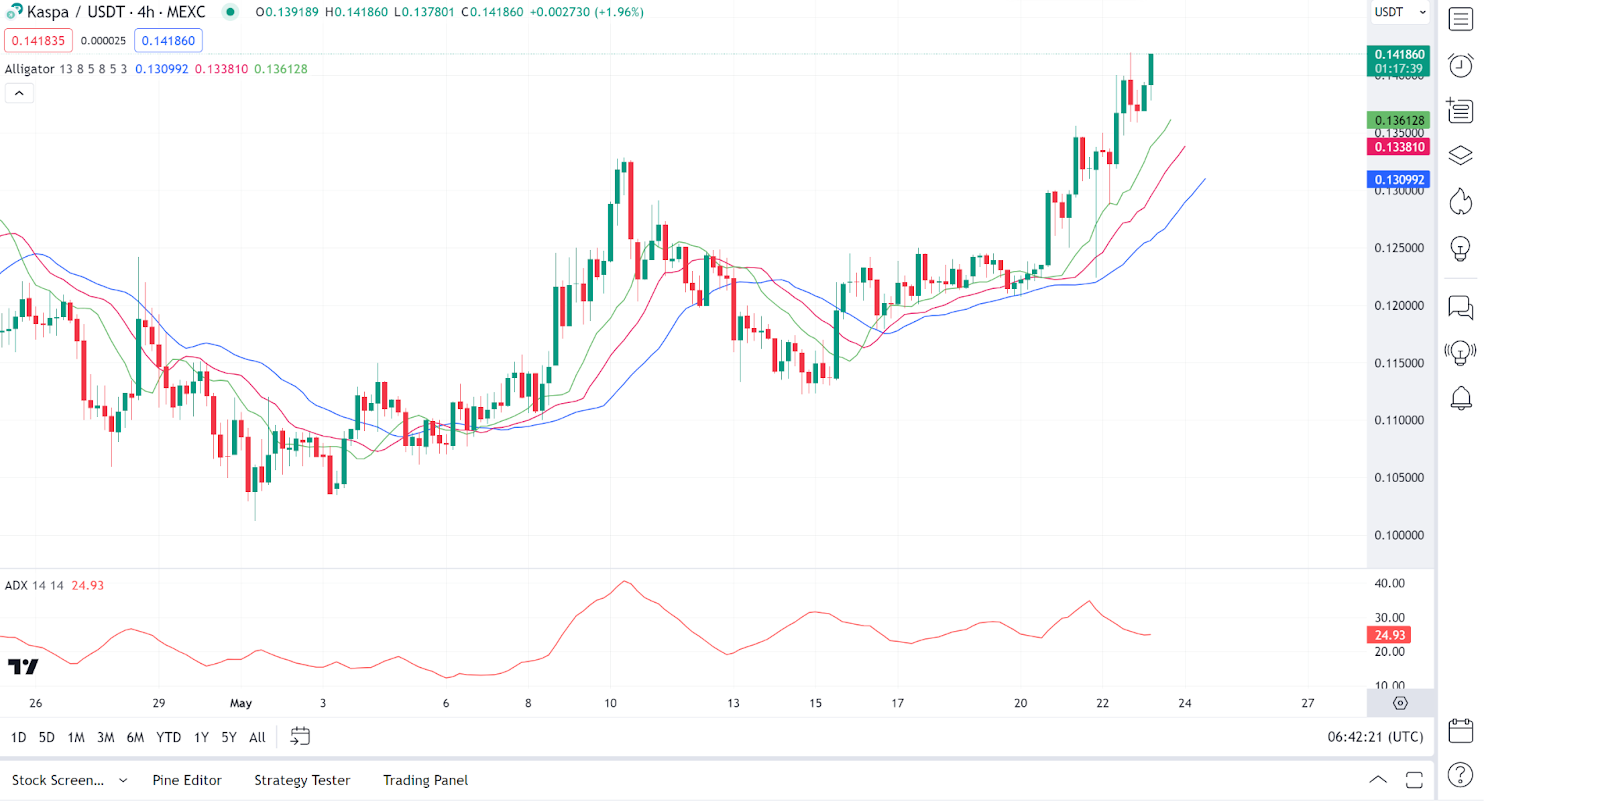
Kaspa (KAS) is also among the gainers in today’s session as evidenced by its price movements. An in-depth analysis of Kaspa price charts shows that Kaspa exhibits a moderate upward trend within a rising channel, showing higher lows and higher highs.
On the other hand, the Alligator indicator shows a bullish alignment, with the jaw (blue), teeth (red), and lips (green) lines in the correct order for a continued upward trend. However, the ADX holds a value of 24 indicating a weak bull trend. As of press time, the Kaspa price stood at $0.1412, a 6.16% increase in valuation over the last 24 hours.
Dogwifhat Price Review
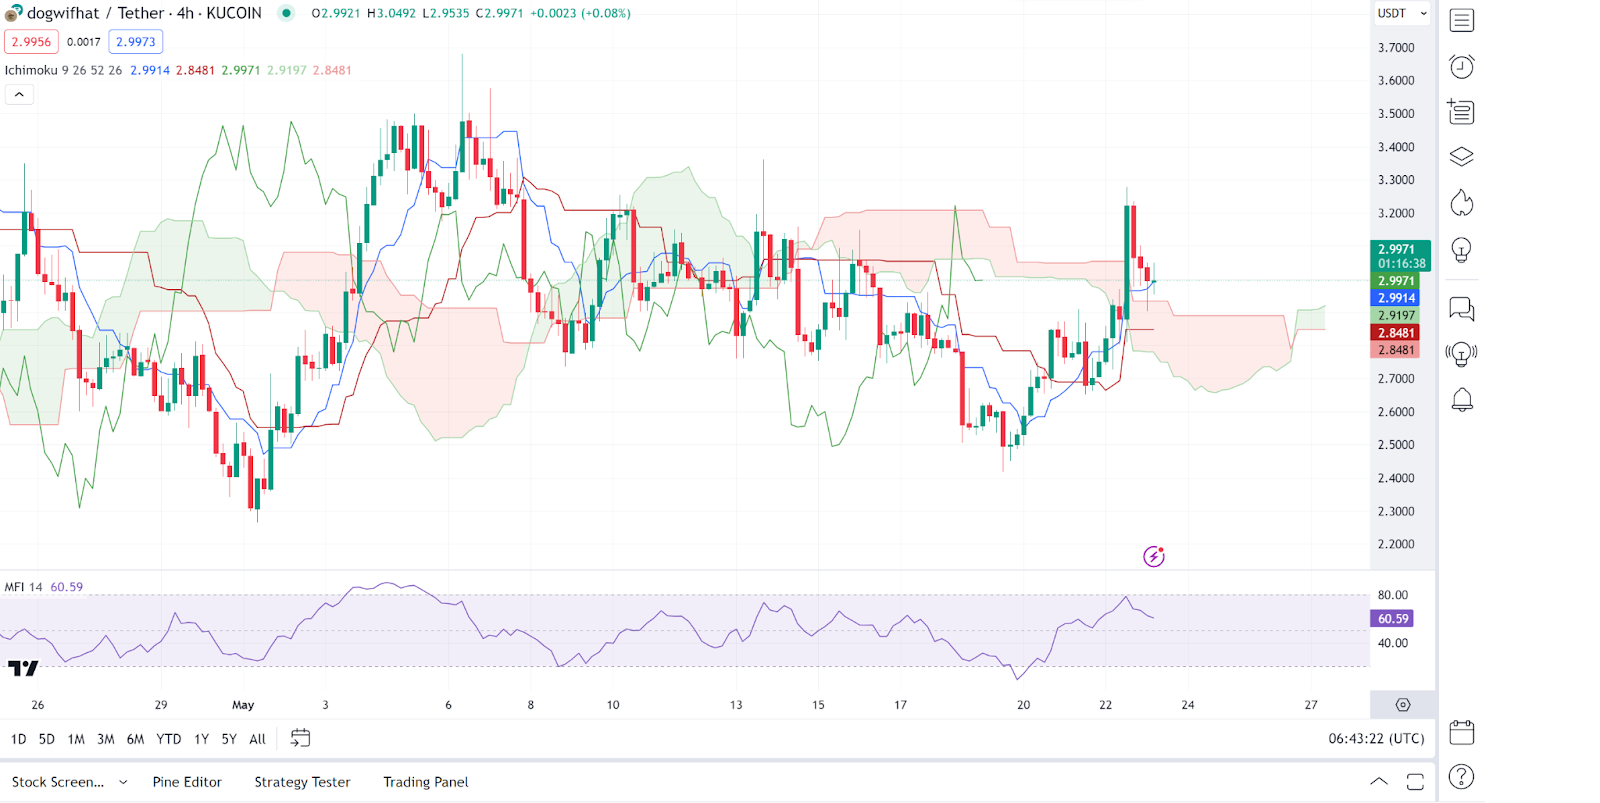
Dogwifhat (WIF) is also among the gainers in today’s session, as seen from its price movements. An in-depth analysis shows that the Ichimoku Cloud is mixed, with the Dogwifhat price currently between the red cloud (Senkou Span B) and the green cloud (Senkou Span A), indicating a lack of a clear trend.
On the other hand, the money flow index is now heading south, indicating increasing selling pressure on the meme coin. As of press time, the Dogwifhat price stood at $3.01, a 5.54% increase in valuation over the last 24 hours.
Pepe Price Review
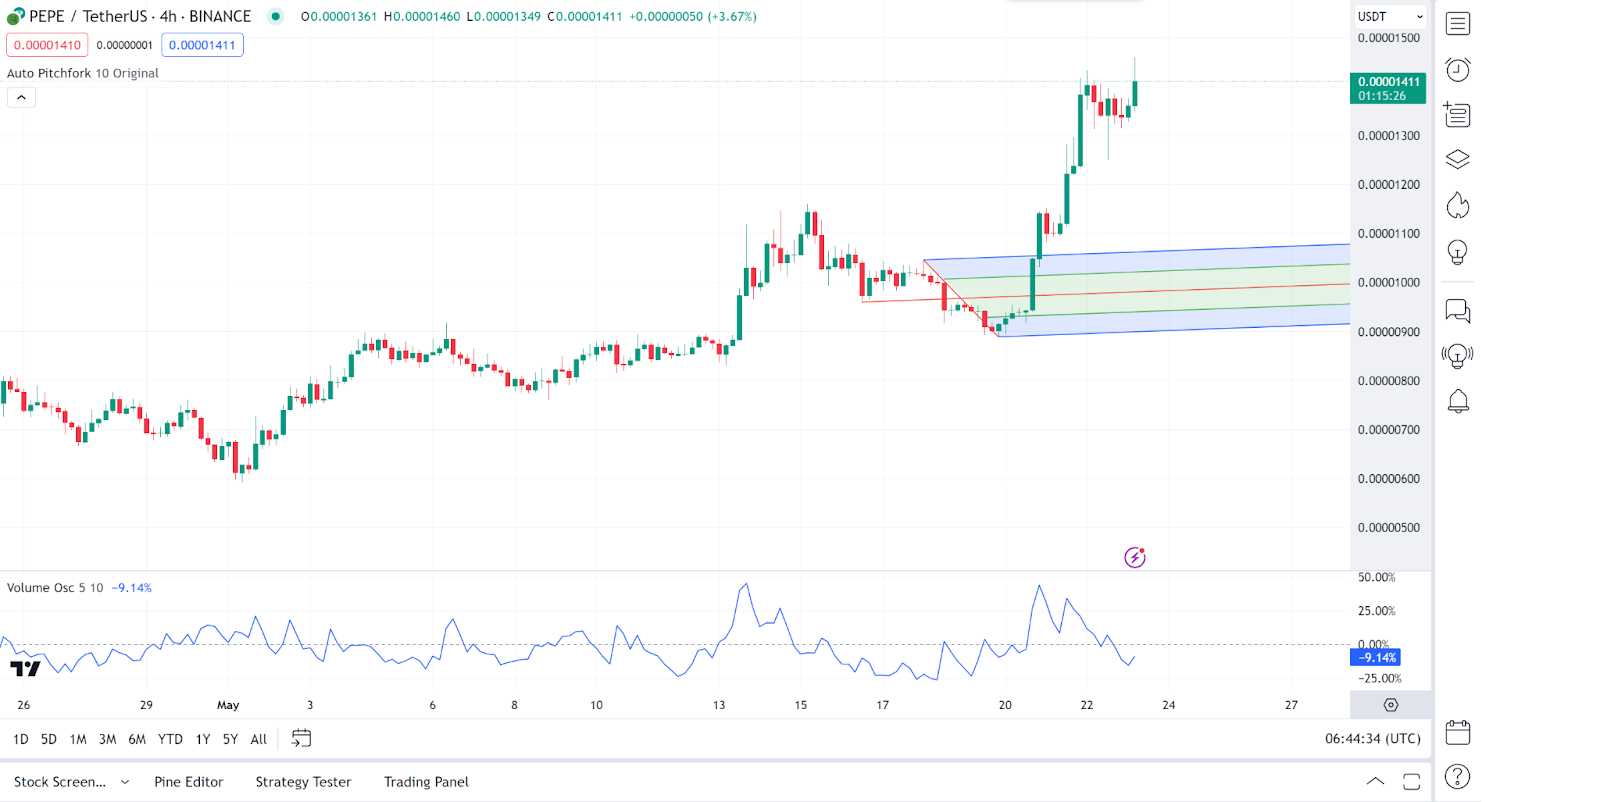
Pepe (PEPE) is also among the gainers in today’s session as seen from the token’s price increase. An in-depth analysis shows that the Pepe price action shows a recent bullish rally after a consolidation phase. The Auto Pitchfork indicates that the Pepe price is currently testing the median line, which could be a pivot point for further movements.
On the other hand, the volume oscillator, currently in the negative, is headed north, indicating a changing momentum from bearish to bullish. As of press time, the Pepe price stood at $0.0000142, representing a 3.5% increase over the last 24 hours.