Litecoin (LTC) Price Insights: Bullish Signals and Key Metrics to Watch
In this analysis, we delve into the recent market behavior of LTC, examining key technical indicators and on-chain metrics.
We will explore the significance of Litecoin’s interaction with the Ichimoku cloud, the implications of its Spent Output Profit Ratio (SOPR) and Adjusted SOPR (aSOPR) values, and address potential resistance and support levels.
Litecoin’s Bullish Signal: Testing the Daily Ichimoku Cloud
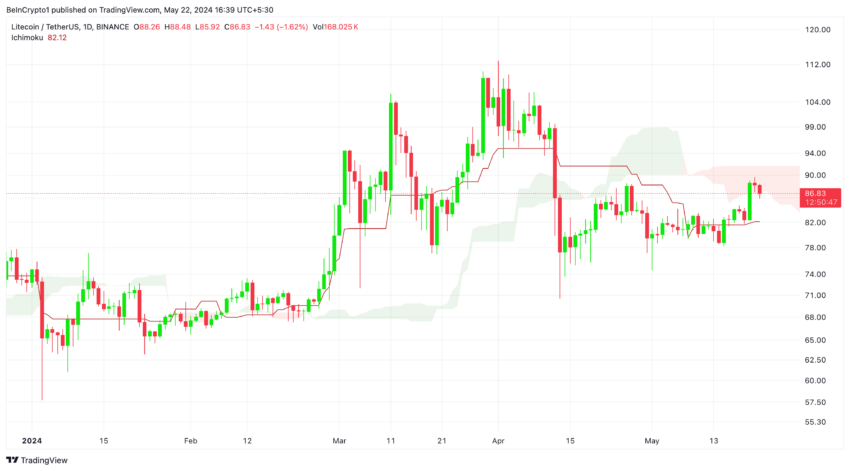
Litecoin (LTC) has recently tested the lower boundary of the daily Ichimoku cloud, which is a positive bullish signal. This development suggests potential upward momentum, especially if Bitcoin continues its rise to $73,000. A successful cloud penetration could propel LTC towards the crucial resistance level at $93.
 LTC/USDT (1D). Source: TradingView
 Key Support Levels (4H):
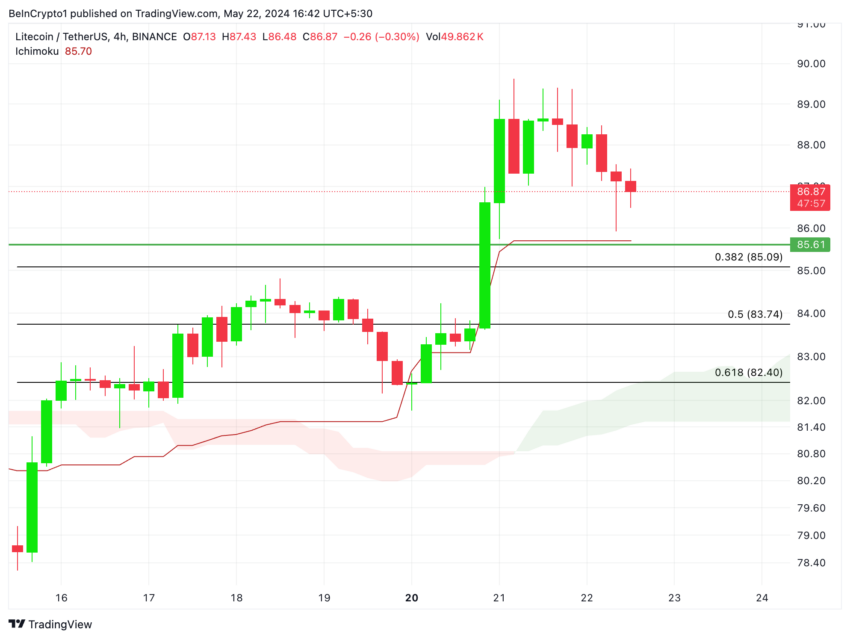
The Ichimoku cloud provides additional support around the $85.70 level. Staying above this cloud is important for sustaining the bullish trend. A break below the cloud could lead to increased selling pressure and a potential reversal of the recent gains.
$85.09 (38.2% Fibonacci Level): This level serves as the first line of defense for LTC. A break below this support could signal a weakening of the bullish trend and might lead to further downward pressure.
Read More: How To Buy Litecoin (LTC) and Everything You Need To Know
$83.74 (50% Fibonacci Level): The 50% retracement level is a critical support zone. Holding above this level is crucial for maintaining a bullish outlook. A dip below this point could indicate a potential trend reversal.
$82.40 (61.8% Fibonacci Level): Often referred to as the “golden ratio,” this level is significant in technical analysis. If LTC fails to sustain above 82.40, it could invalidate the current bullish momentum and shift the market sentiment
Potential Price Projections
If LTC breaks through the Ichimoku cloud, the next significant resistance to watch is $93. This level could see substantial selling pressure. Conversely, a break below the Tenkan plateau of $81 could signal a potential trend reversal, necessitating caution.
 LTC/USDT (4H). Source: TradingView
 SOPR and aSOPR Indicate Positive Fundamentals
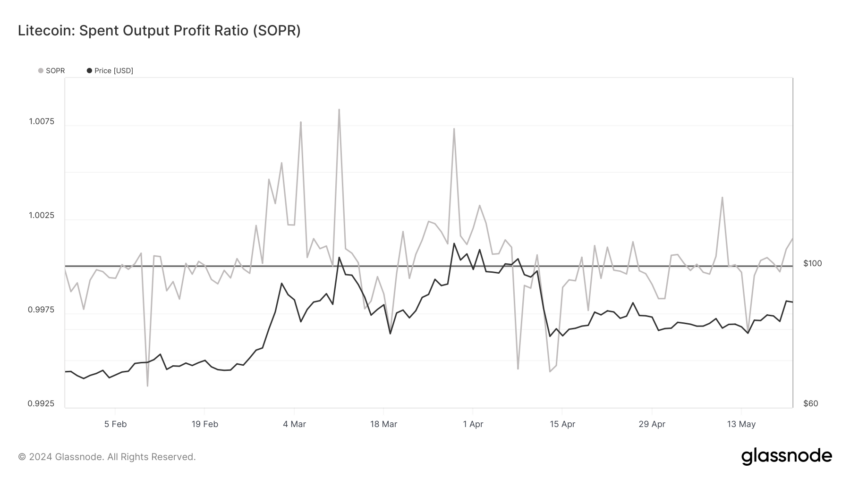
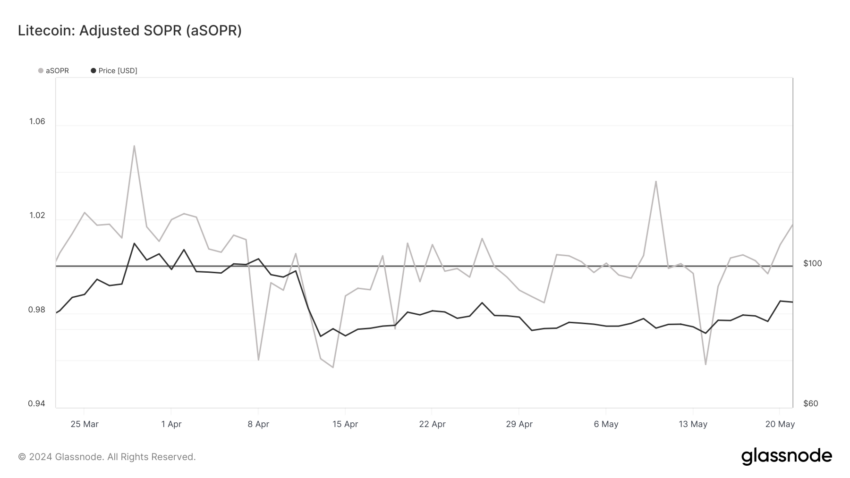
The Spent Output Profit Ratio (SOPR) and Adjusted Spent Output Profit Ratio (aSOPR) for Litecoin are above 1, indicating that more LTC transactions are occurring at a profit. This is a strong bullish indicator as it reflects positive market sentiment and fundamental strength.
SOPR Analysis: Litecoin’s SOPR has consistently stayed above the 1.0 threshold, showing that holders are selling at a profit. This aligns with recent price movements and suggests continuing bullish trends.
 LTC SOPR. Source: Glassnode
 aSOPR Analysis: Similarly, the aSOPR confirms the same bullish sentiment. The aSOPR has also remained above 1, indicating profitable spending and reinforcing the bullish outlook.
Read More: Litecoin (LTC) Price Prediction 2024/2025/2030
 LTC aSOPR. Source: Glassnode
 Strategic Recommendations: Bullish to Neutral Outlook
Litecoin shows promising bullish signals by testing the Ichimoku cloud and maintaining positive SOPR and aSOPR values.
Traders should watch for a cloud breakthrough for potential gains while being cautious of a break below the 4H Tenkan plateau, which could indicate a trend reversal.
Additionally, the growth rate of addresses holding ADA is a metric to monitor for future price implications.


