ENA Falling Wedge Breakout Signals Potential Price Rally
NAIROBI (CoinChapter.com) — Ethena (ENA) depicts a falling wedge pattern on the 1-day price, indicating potential bullish momentum. Notably, this pattern, observed over the past few weeks, suggests that ENA might be gearing up for a breakout. On May 21, 2024, ENA traded at $0.726192 with a market cap of $1.10B and a 24-hour trading volume of $169.93M. This technical analysis explores the current situation and future price movements.
Technical Analysis: Bullish Momentum Builds
The falling wedge breakout in Ethena’s price chart is a pivotal technical event. Historically, this bullish pattern occurs when the price consolidates between two downward-sloping, converging trendlines. On May 20, 2024, Ethena broke above the upper trendline of the wedge at $0.74. This breakout led to a significant price surge, with ENA reaching $0.816. The breakout suggests the end of the downtrend and the beginning of a new upward trajectory.

Additionally, the Relative Strength Index (RSI) is currently at 67, indicating strong buying pressure without being overbought. The Moving Average Convergence Divergence (MACD) indicator shows a bullish crossover, with the MACD line crossing above the signal line, strengthening the bullish outlook for Ethena.
The next resistance level is at $1.213. Surpassing this hurdle could lead to substantial gains for Ethena. The breakout, combined with favorable technical indicators, supports a bullish bias, suggesting Ethena is poised for continued upward movement.
ENA’s On-Chain Metrics Highlight Robust Growth and Liquidity
Interestingly, Ethena’s on-chain data reveals key market dynamics and investor behavior. The total value locked (TVL) is $2.479 billion, showing strong user engagement. Additionally, Ethena generates $105.23 million in annualized fees, indicating significant revenue potential.
Moreover, the platform’s annualized revenue is $8.69 million, reflecting its income generation capacity. With a 24-hour trading volume of $140.64 million, Ethena demonstrates high liquidity and active trading interest. Its fully diluted valuation (FDV) stands at $11.145 billion, highlighting future growth potential.
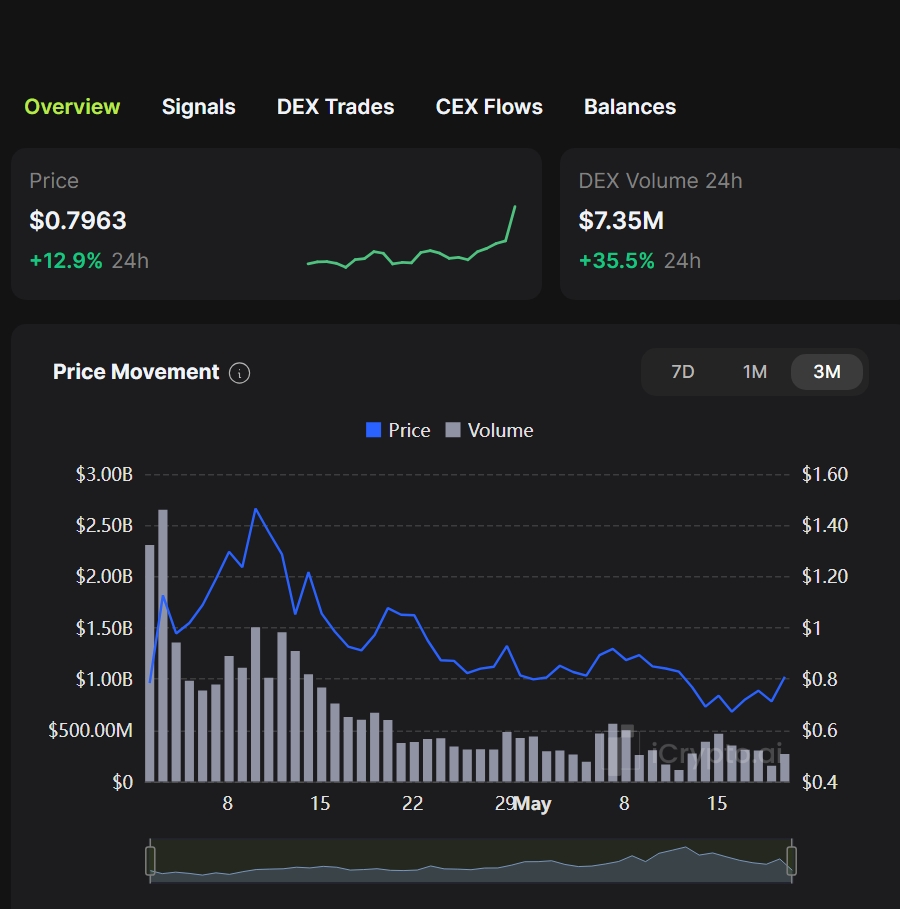
Recent data shows a 35.5% increase in decentralized exchange (DEX) volume, with $7.35 million traded in the last 24 hours. Notably, Ethena’s price rose by 12.9% to $0.7963, driven by higher trading volume and positive sentiment. Above all, this robust on-chain activity underscores Ethena’s strong market position and diverse investor participation.
The post ENA Falling Wedge Breakout Signals Potential Price Rally appeared first on CoinChapter.