Bitcoin Breaking the Resistance: Where Will It Reach This Week? $71,000 or $73,000?
The post Bitcoin Breaking the Resistance: Where Will It Reach This Week? $71,000 or $73,000? appeared first on Coinpedia Fintech News
In the short term, the Bitcoin price appears to have been stuck within a range, but in the long term, the token is following a pre-programmed upswing. After the well-known rebound from levels below $60,000, the price is following a notable ascending trend, which appears to have revived a strong bullish trajectory within the markets. Therefore, even though the start of the month was bearish, the BTC price is expected to close the trade on a bullish note.
After a shake-up or a false breakout, relative to the liquidity zone of $59,000 to $60,000, a bullish impulse was formed, which was influenced by fundamental reasons. There were signs of more correction, but the bulls held a strong defence above $64,500, where the buyers pushed the price up and tested the resistance at $67,250. In a larger perspective, Bitcoin looks quite bullish, with an attempt to break through the resistance.
Will the consolidation end with the bulls pushing the price to $71,000? Can the bulls sustain the growth or face rejection thereafter?
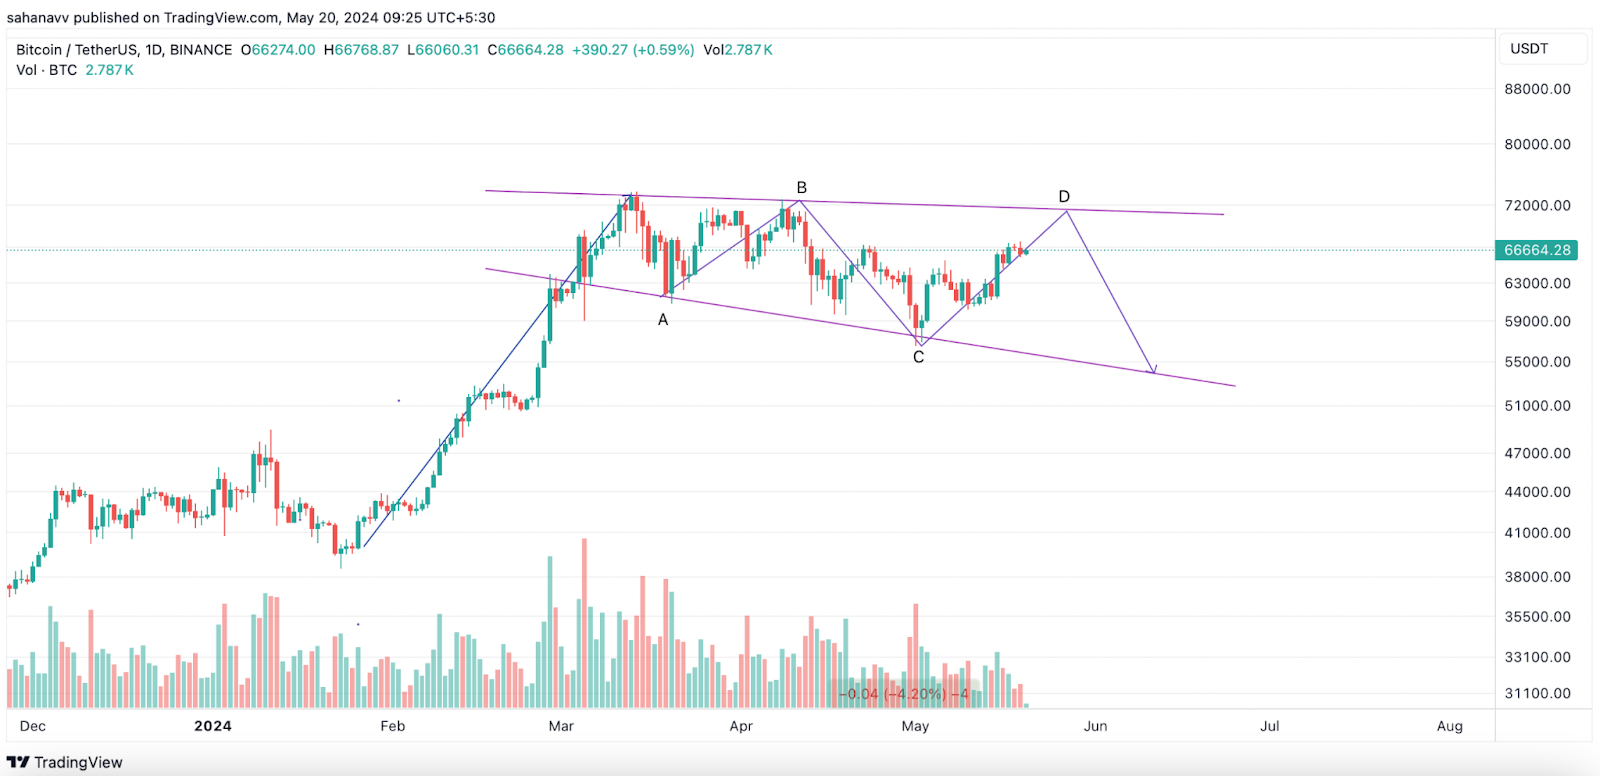
As seen in the above daily chart, the BTC price is trading within an expanding megaphone and heading towards the upper resistance after rebounding from the lower channel. However, the technicals are pointing towards a diverse trend as they are about to flash a ‘sell’ signal.
- Bollinger Bands: the bands are expanded at the moment but the price has reached the upper threshold. This suggests the price may soon undergo a bearish pullback, which may drag the levels close to $63,000
- MACD: the indicator displays that the buying pressure is fading, which may halt the attempt to rise within the positive range
- RSI: the levels remain stagnant, with no major movements, which suggests a pullback could be on the horizon
- Ichimoku Cloud: the cloud is heading for a bullish crossover, but more consolidation may be expected as the levels may consume more time for the crossover
- Directional Movement Indicator (DMI): the indicator underwent a bullish crossover but may soon face a bearish crossover, while the ADX is slowly rising, which keeps the bullish hopes alive
While bullish hopes continue to remain high, the short-term trade suggests a small pullback could be fast approaching. Therefore, with an influx of fresh liquidity, the Bitcoin (BTC) price is expected to trigger a fresh upswing soon.