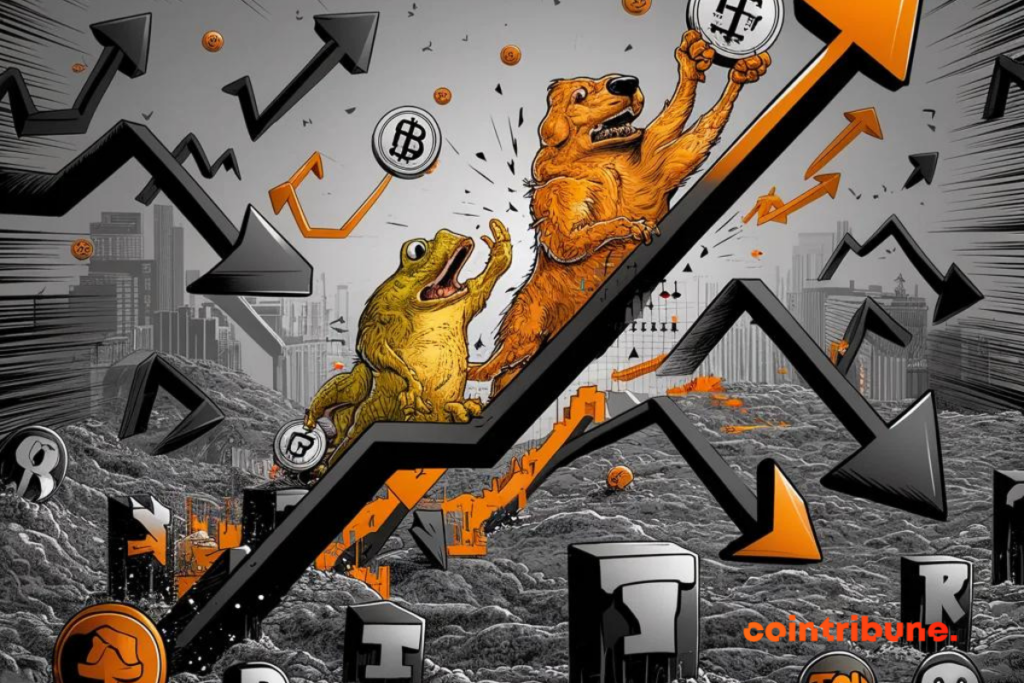
Shiba Inu Price Analysis Hints 35% Upside as Buyers Break 50-Day Consolidation
Shiba Inu Price Analysis: Shiba Inu, one of the top names in the meme coins sector, stands at a bullish crossroads. The meme coins are siphoning additional momentum with the Bitcoin price crossing the $67,000 threshold. The Shiba Inu token jump shows a potential trend reversal arriving with Bitcoin starting its post-halving rally. Will this $14.4 billion meme coin cross the $0.000024 mark with a fresh buying spree?
Also Read: Shiba Inu Takes Center Stage With Dedicated Payment Page On Binance Pay
SHIB Eyes $0.00003285 with Pattern Breakout and Increased Demand

The downtrending SHIB price action shows the high possibility of a trend reversal as the broader market recovery gains momentum. With the recent jump of 13% over the past 6 days, the meme coin signals an end-of-correction phase with a pattern breakout.
As the recent surge overcomes the overhead resistance trendline, Shiba Inu shows a symmetrical triangle breakout. Furthermore, the meme coin shows a double bottom reversal with a neckline at $0.0000262.
As the underlying demand increases, the multiple pattern breakout signals a potential bull run. This is because the trapped momentum within the pattern can now pump the SHIB price in the coming days.
Currently, the SHIB price trades at $0.0000245 with an intraday loss of 2.1% following the 1.83% surge last night.
The triangle breakout rally shows potential to reach the $0.000028 mark by the end of this month. Optimistically, an uptrend continuation could reach the $0.00003285 mark, if the momentum sustains.
On the flip side, a correction in the broader market might dump the meme coin under the $0.00002 mark.
Technical Indicator:
- Exponential Moving Average: The bullish crossover in the 20 and 50 day EMAs will put the crucial average lines in a positive alignment.
- Directional Movement Index: An uptick in the DMI line reflects a rise in the trend momentum with the triangle breakout. Further, the VI lines are in a positive alignment projecting a bullish phase in motion.
The post Shiba Inu Price Analysis Hints 35% Upside as Buyers Break 50-Day Consolidation appeared first on CoinGape.