
Bitcoin (BTC) Price Reaches Critical Resistance, Potential Bearish Rejection Ahead
The Bitcoin (BTC) price has reached the critical golden ratio resistance at around $67,500. BTC has been up roughly 10% in the last four days.
However, Bitcoin is now encountering significant resistance. Will this lead to a bearish rejection for BTC?
Will Bitcoin’s Current Price Return to the Upward Trend?
Bitcoin’s price has risen over 10% in the last four days, forming a bullish price pattern. This is due to Bitcoin creating an inverse head-and-shoulders pattern, from which the BTC price has already broken out bullishly.
The golden ratio near $67,500 coincides with BTC’s crucial Fibonacci resistance. A bullish break at this level would signal a return to an uptrend for Bitcoin. Consequently, the corrective movement would be invalidated, and Bitcoin could target or even exceed its previous all-time high of around $73,800.
The Exponential Moving Averages (EMAs) have a golden crossover, and the Moving Average Convergence Divergence (MACD) lines are also bullishly crossed. The MACD histogram is ticking bullishly higher, while the Relative Strength Index (RSI) is neutral. Overall, the indicators in the daily chart are bullish.
Read more: Bitcoin Price Prediction 2024/2025/2030
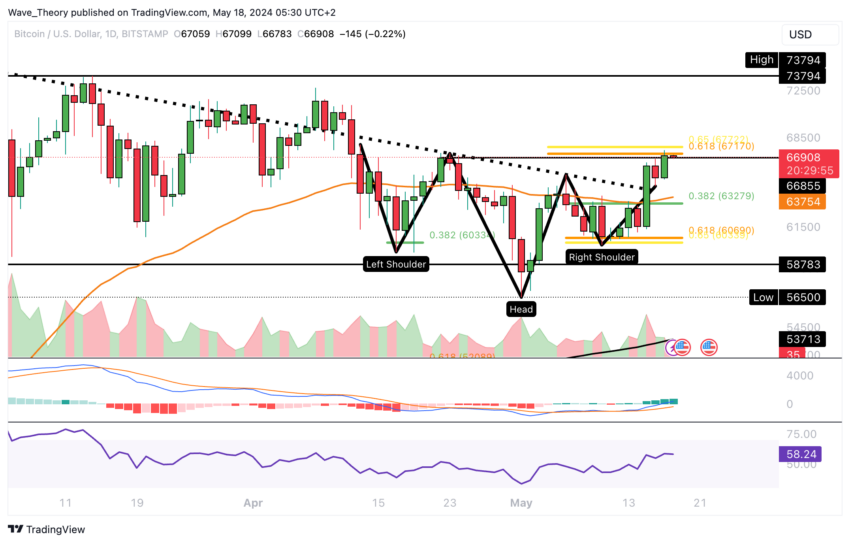 BTC/USD Price Analysis (Daily). Source: TradingView
 However, the 4-hour (4H) chart indicators are signaling bearish tendencies. The BTC price could face short-term bearish pressure and be rejected at the golden ratio resistance near $67,500.
This is because the RSI is showing a bearish divergence, and the MACD lines are about to make a bearish crossover. Additionally, the MACD histogram is already ticking lower in a bearish manner.
Only the EMAs are giving bullish signals due to the golden crossover. This suggests that the trend remains bullish in the short term.
It is important to note that Bitcoin’s price could initiate a correction to reach the 0.382 Fibonacci (Fib) level at around $63,280. That scenario marks a downside potential of around 5.4%. Beyond that, significant support awaits the BTC price at around $60,500.
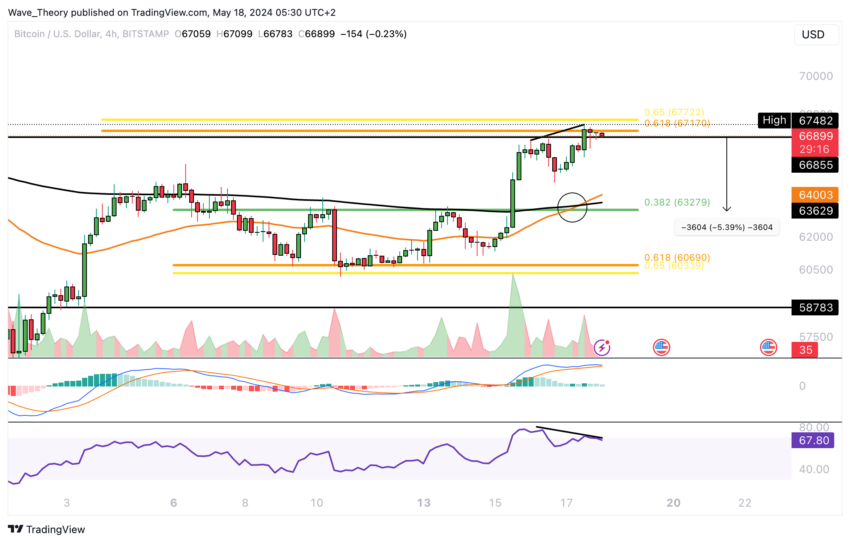 BTC/USD Price Analysis (4H). Source: TradingView
 Bitcoin Dominance Continues Rising in Parallel Upward Channel
Furthermore, the weekly chart suggests potential signs of the end of the corrective movement. Bitcoin stayed above the golden ratio support at around $60,500 and has risen over 11% this week.
The MACD histogram has started to tick higher this week after trending lower for six consecutive weeks. However, the MACD lines remain in a bearish crossover, and the RSI is moving into neutral territory.
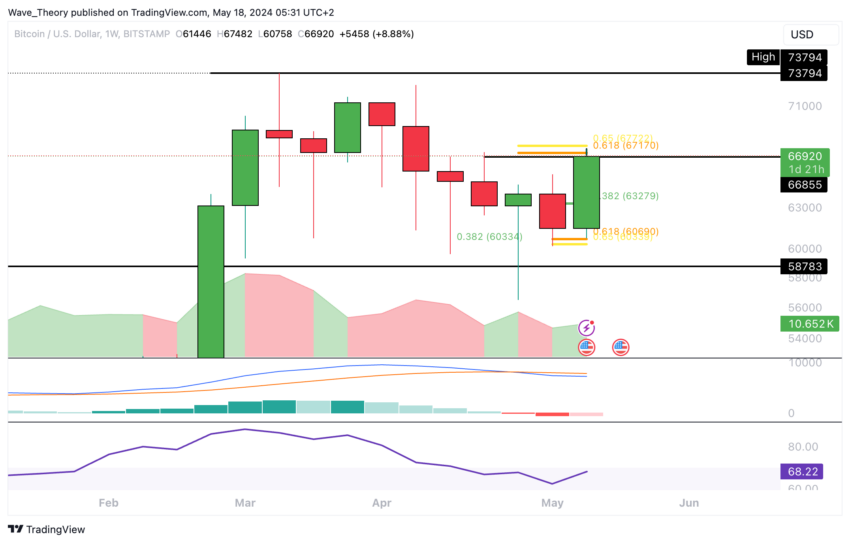 BTC Price Analysis (Weekly). Source: TradingView
 Meanwhile, in the monthly chart, the MACD histogram is ticking higher again this month after ticking lower last month. The MACD lines remain in a bullish crossover, and the RSI is nearing overbought regions.
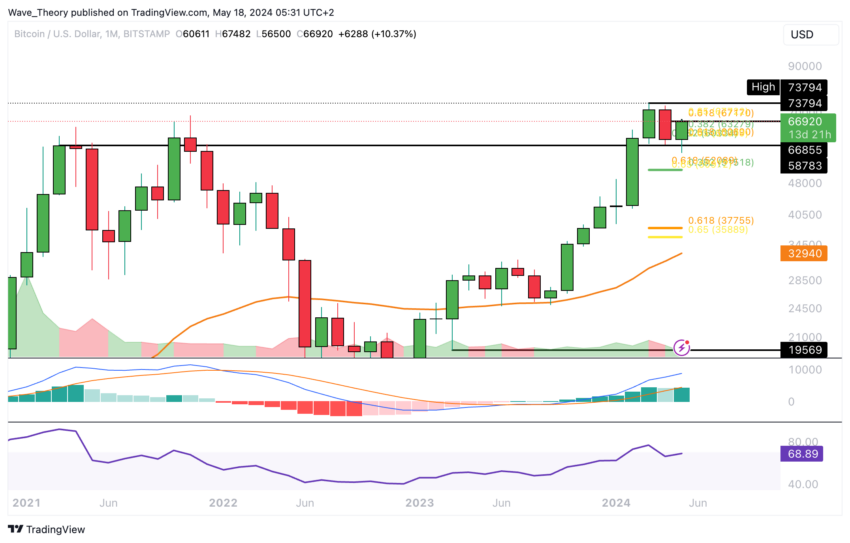 BTC Price Analysis (Monthly). Source: TradingView
 Bitcoin dominance continues to move upwards within the parallel upward channel. The next significant Fib resistance is at around 60.5%.
On the downside, Bitcoin’s dominance finds significant support at the 50-month EMA, around 52.65%. Additional significant Fib supports are at approximately 50% and 45%.
The MACD lines are bullishly crossed, and the RSI is in neutral territory. However, the MACD histogram has been ticking lower for several months.
Read more: How To Buy Bitcoin (BTC) and Everything You Need To Know
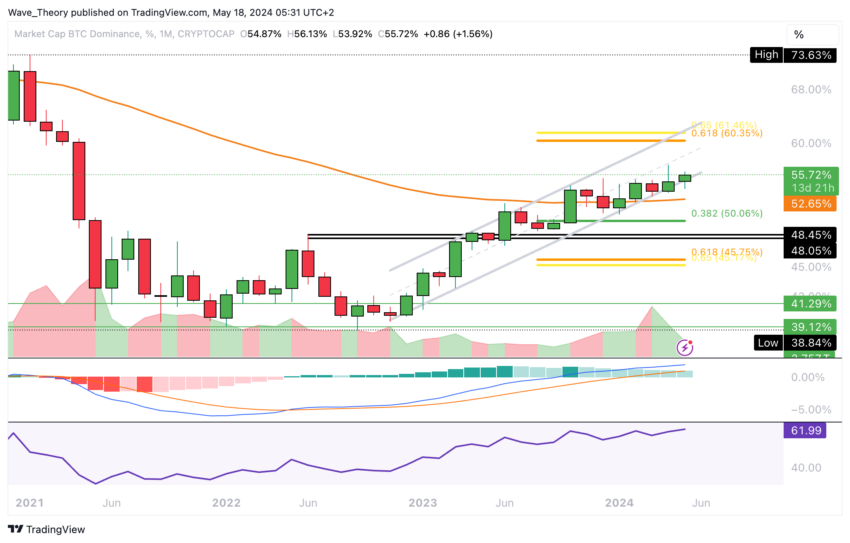 BTCD Analysis (Monthly). Source: TradingView
 Nonetheless, Bitcoin’s dominance (BTCD) is in a clear upward trend. If the BTC price breaks out bullishly, this could further spur Bitcoin dominance.