Web3, Blockchain, and Crypto Weekly Update: Major News, Market Trends, and Key Insights
The post Web3, Blockchain, and Crypto Weekly Update: Major News, Market Trends, and Key Insights appeared first on Coinpedia Fintech News
Welcome to your go-to source for all things Web3, Blockchain and Crypto! Our Weekly report dives into the freshest updates and game-changing developments in the fast-paced world. We curate the best data from trusted sources to keep you ahead of the curve. Ready to stay informed and inspired? Let’s explore the latest trends and insights together!
1. Web3, Blockchain & Crypto Breaking News This Week
Here are the major breaking news reports, related to the Web3, Blockchain and crypto world, reported this week.
- Consumer Price Index Rises to 3.4% in April; Bitcoin Price Surges to $64k
The Consumer Price Index increased by 3.4% over the past year, exceeding expectations of a 2.9% rise. Parallely, Bitcoin’s price jumped to $64,000.
- Senate Passes Bill Overturning SEC’s Crypto Guidelines
The Senate passed H.J. res, 109 to overturn SEC’s guidelines on cryptocurrency accounting, potentially allowing banks to hold Bitcoin and other digital assets. President Biden may veto the bill, adding uncertainty to the regulatory landscape.
- El Salvador Mines Bitcoin Using Volcanic Geothermal Energy
El Salvador has mined 474 Bitcoins, worth $29 million, using geothermal energy from the Tecapa volcano. The country’s total Bitcoin holdings are now 5,750, valued at $354 million, showcasing a green approach to accumulating cryptocurrency.
- Binance Executive Denied Bail in Nigerian Court Case
Justice Emeka Nwite denied bail to Tigran Gambaryan, a Binance executive accused of money laundering and tax violations in Nigeria. The legal proceedings highlight the regulatory challenges facing major cryptocurrency companies.
- Bill Proposed to Abolish Federal Reserve Amid Inflation
Representative Thomas Massie introduced a bill to abolish the Federal Reserve, blaming its policies for high inflation. He argues that the Fed’s actions during the COVID-19 pandemic devalued the dollar, pushing people towards cryptocurrencies as alternative stores of value.
2. Blockchain Weekly Analysis
The blockchain weekly analysis primarily covers the blockchain dominance analysis and the blockchain 7-day change analysis. In order to bring more clarity, the Layer 1 chains and Layer 2 chains are analysed separately.
2.1. Blockchain Dominance Analysis
Ethereum, TRON, BNB Smart chain, Solana, and Arbitrum One are the top five blockchains as per dominance and TVL.
| Blockchains | Dominance | TVL |
| Ethereum | 60.71% | $52,713,518,411 |
| TRON | 9.92% | $8,610,792,735 |
| BNB Smart Chain | 6.98% | $6,059,524,171 |
| Solana | 5.22% | $4,528,351,343 |
| Arbitrum One | 3.04% | $2,641,783,459 |

Among the top five chains, Ethereum dominates with 60.71%. TRON and BNB Smart Chain follow with 9.92% and 6.98%. Solana has a dominance of 5.22% and Arbitrum One 3.04%.
2.1.1. Top Five Layer 1 Chains By Dominance
Ethereum, BNB Smart Chain, Solana, Bitcoin and Avalanche are the top five Later 1 Blockchains.
| Layer 1 Blockchains | Dominance | TVL |
| Ethereum | 77.31% | $52,646,879,307 |
| BNB Smart Chain | 8.89% | $6,051,863,873 |
| Solana | 6.64% | $4,522,626,716 |
| Bitcoin | 1.64% | $1,115,232,049 |
| Avalanche | 1.38% | $942,995,040 |

Among the top five Layer 1 chains, Ethereum dominates with a dominance of 77.31%. BNB Smart Chain and Solana follow with 8.89% and 6.64%, respectively. Bitcoin marks 1.64% dominance, and Avalanche registers 1.38% dominance.
2.1.2. Top Five Layer 2 Chains By Dominance
Arbitrum One, Base, Blast, Polygon POS, and Optimism are the top five Layer 2 Blockchains.
| Layer 2 Blockchains | Dominance | TVL |
| Arbitrum One | 29.85% | $2,635,176,183 |
| Base | 17.29% | $1,526,465,299 |
| Blast | 17.08% | $1,508,006,967 |
| Polygon POS | 10.19% | $899,505,619 |
| Optimism | 8.83% | $779,597,461 |

Among the top five Layer 2 chains, Arbitrum One dominates with a dominance of 29.85%. Base and Blast closely follow with 17.29% and 17.08%, respectively. Polygon POS marks a dominance of 10.19%, and Optimism records a dominance of 8.83%.
2.2. Blockchain 7-Day Change Analysis
Let’s analyse the top five Layer 1 chains using the 7-day change index.
| Layer 1 Blockchains | 7-Day Change |
| Ethereum | -1.8% |
| BNB Smart Chain | -3.4% |
| Solana | +9.5% |
| Bitcoin | -7.0% |
| Avalanche | +1.6% |
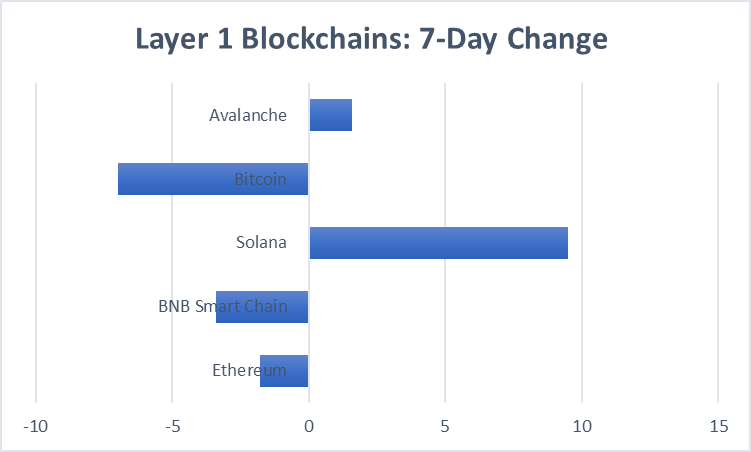
Among the top five chains, only Solana and Avalanche show positive changes. Solana registers the highest positive change of +9.5%, while Avalanche records an moderate positive change of +1.6%. Bitcoin showcases the highest negative change of -7.0%. BNB smart Chain and Ethereum mark moderate negative changes of -3.4% and -1.8%, respectively.
Let’s analyse the top five Layer 2 chains using the 7-day change index.
| Layer 2 Blockchains | 7-Day Change |
| Arbitrum One | +0.9% |
| Base | -2.3% |
| Blast | -0.1% |
| Polygon POS | -0.4% |
| Optimism | -8.3% |
Among the top five Layer 2 chains, only Arbitrum One displays a positive change; it records a very moderate positive change of +0.9%. The highest negative change is shown by Optimism, with -8.3% change. Base shows a moderate change of -2.3%. Polygon POS and Blast showcase very moderate changes of -0.4% and -0.1%.
3. Cryptocurrency Weekly Analysis
The Cryptocurrency Weekly analysis covers a wide range of analyses, from the general cryptocurrency market cap analysis and the top gainers and losers analysis to the Stabelcoin, Memecoin, AI Coins and Metaverse Coins analyses.
3.1. Top Cryptocurrency Categories By Market Cap
Layer 1 (LI), Smart Contract Platform, Andreessen Horowitz (a16z) Portfolio, Alameda Research Portfolio, and Alleged SEC Securities are the top five cryptocurrency categories by Market Cap. The Layer 1 (L1) category, with $1,975,884,413,592 market cap, is the one with the highest market cap. The Smart Contract Platform category follows with $678,209,531,506.
| Crypto Categories | Market Cap | 7-Day Change |
| Layer 1 (L1) | $1,975,884,413,592 | +3.6% |
| Smart Contract Platform | $678,209,531,506 | +1.1% |
| Andreessen Horowitz (a16z) Portfolio | $529,706,320,259 | +1.5% |
| Alameda Research Portfolio | $476,950,967,546 | +1.4% |
| Alleged SEC Securities | $254,824,240,832 | +2.7% |
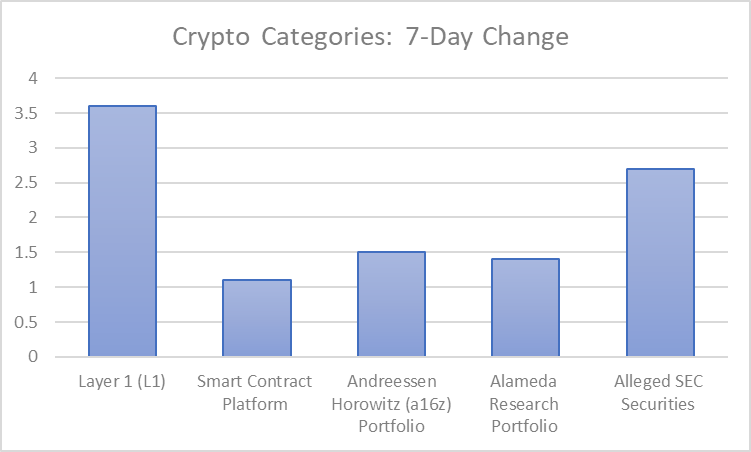
Among the top five crypto categories, Layer 1 (L1) marks the highest 7-day change of +3.6%. Alleged SEC Securities closely follows with +2.7%. Andreessen Horowitz (a16z) Portfolio, Alameda Research Portfolio, and Smart Contract Platform record +1.5%, +1.4% and +1.1% change, respectively.
3.1.1. Trending Categories This Week
Wall Street Bets Themed Coins, Parody Meme Coins, PolitiFi, Base Meme Coins, Cat-Themed Coins, and DePIN are the most trending categories this week.
| Trending Categories | Market Cap |
| Wall Street Bets Themed Coins | $59.4M |
| Parody Meme Coins | $496M |
| PolitiFi | $819M |
| Base Meme Coins | $942M |
| Cat-Themed Coins | $1.74B |
| DePIN | $29.3B |
Among the trending categories, DePIN stands out as it has an impressive market cap of $29.3B, which is the highest among the six. Cat-themed coins follow with a market cap of $1.74B. Base Meme Coins and PolitiFi record $942M and $819M market cap, respectively. Parody Meme Coins and Wall Street Bets Themed Coins register $496M and $59.4M market cap, respectively.
3.2. Top Cryptocurrencies By Market Cap
Bitcoin, Ethereum, Tether, BNB, and Solana are the top five cryptocurrencies by market cap. Bitcoin has the highest market cap of $1,308,281,130,156. Ethereum follows with a market cap of $364,014,920,398.
| Cryptocurrencies | Market Cap | 7-Day Change |
| Bitcoin | $1,308,281,130,156 | +5.2% |
| Ethereum | $364,014,920,398 | -0.7% |
| Tether | $111,655,892,722 | +0.3% |
| BNB | $89,098,450,093 | -2.8% |
| Solana | $75,786,549,695 | +9.0% |
Among the top five cryptos, Solana, Bitcoin and Tether show positive changes this week. Solana marks the highest 7-day change of +9.0%. Bitcoin follows with a change of +5.2%. Tether shows a moderate change of +0.3%. BNB and Etheruem display negative changes. BNB records a negative change of -2.8%, and Ethereum a very moderate negative change of -0.7%.
3.2.1. Trending Coins This Week
Apu Apustaja, Drift Protocol, Brett, Ondo, and Toncoin are the most trending cryptocurrencies at the time of preparing this analysis.
| Trending Cryptocurrencies | Market Cap |
| Apu Apustaja | $286,023,118 |
| Drift Protocol | $54,742,896 |
| Brett | $360,132,340 |
| Ondo | $1,353,833,209 |
| Toncoin | $23,478,151,394 |
Among the trending cryptos, Toncoin has the highest market cap of $23,478,151,394. Ondo follows with $1,353,833,209. Brett and Apu Apustaja show $360,132,340 and $286,023,118, respectively. Drift Protocol displays the lowest market cap of $54,742,896.
3.2.2. Top Gainers & Losers This Week
GME, MAGA VP, SIPHER, ConstitutionDAO, and Spectral are the top gainers of the week as per the 7-day gain index.
| Top Gainers | 7-Day Gain |
| GME | +1222.2% |
| MAGA VP | +185.2% |
| SIPHER | +161.5% |
| ConstitutionDAO | +81.0% |
| Spectral | +68.1% |

GME records the highest gain of +1222.2%. MAGA VP and SIPHER follow with +185.2% and +161.5%, respectively. ConstitutionDAO and Spectral record +81.0% and +68.1% gain, respectively.
Shark Cat, ALEX Lab, PunkCity, NORMIE, and Entangle are the top losers of the week as per the 7-day loss index.
| Top Losers | 7-Day Loss |
| Shark Cat | -46.5% |
| ALEX Lab | -40.5% |
| PunkCity | -37.8% |
| NORMIE | -35.7% |
| Entangle | -35.7% |
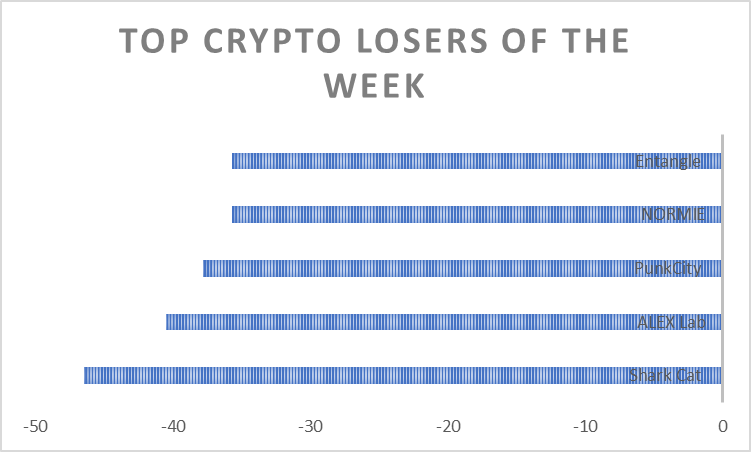
Shark Cat displays the highest loss of -46.5%. ALEX Lab and PunkCity closely follow with -40.5% and -37.8%, respectively. Both NORMIE and Entangle mark -a 35.7% loss.
3.3. Top Stablecoins Analysis
Tether, USDC, Dai, First Digital USD, and Ethena USDe are the top five stablecoins as per market cap.
| Stablecoins | Market Cap |
| Tether | $111,404,518,043 |
| USDC | $33,344,450,829 |
| Dai | $5,454,605,060 |
| First Digital USD | $3,611,060,209 |
| Ethena USDe | $2,349,531,273 |
Tether has the highest market cap of $111,404,518,043. USDC and Dai follow with $33,344,450,829, and $5,454,605,060 market cap, respectively. First Digital USD registers a market cap of $3,611,060,209, and Ethena USDe records a market cap of $2,349,531,273.
3.4. Top Memecoins 7-Day Change Analysis
Dogecoin, Shiba Inu, Pepe, dogwifhat, FLOKI are the top five Memecoins as per market cap. Dogecoin has the highest market cap of $22,198,117,707. Shiba Inu and Pepe follow with $14,672,691,432 and $4,284,171,989 market cap, respectively.
| Memecoins | Market Cap | 7-Day Change |
| Dogecoin | $22,198,117,707 | +0.7% |
| Shiba Inu | $14,672,691,432 | +5.6% |
| Pepe | $4,284,171,989 | +17.5% |
| dogwifhat | $2,876,263,223 | -9.8% |
| FLOKI | $2,070,321,488 | +18.0% |
Among the top five Memecoins, only dogwifhat shows a negative 7-day change. FLOKI displays the highest positive change of +18.2%. Pepe closely follows with +17.5%. Shiba Inu marks a change of +5.6%. Dogecoin showcases a moderate positive change of +0.7%. Conversely, dogewifhat records a negative change of -9.8%.
3.5. Top AI Coins 7-Day Change Analysis
Internet Computer, Fetch-ai, Render, The Graph, and Bittensor are the top five AI Coins as per market cap. Internet Computer has the highest market cap of $6,042,458,734. Fetch-ai and Render closely follow with $5,781,641,812 and $3,959,699,597 market cap, respectively.
| AI Coins | Market Cap | 7-Day Change |
| Internet Computer | $6,042,458,734 | +4.9% |
| Fetch-ai | $5,781,641,812 | -1.0% |
| Render | $3,959,699,597 | -10.1% |
| The Graph | $2,950,787,914 | +1.9% |
| Bittensor | $2,614,077,112 | -2.1% |
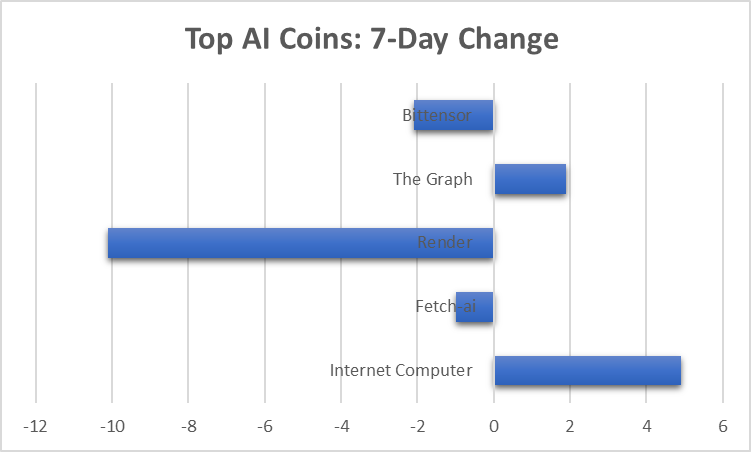
Among the top five AI coins, only two display positive changes this week. Internet Computer marks a positive 7-day change of +4.9%. The Graph shows a moderate positive change of +1.9%. Render records the highest negative change of -10.1%. Bittensor and Fetch-ai follow with -2.1% and -1.0%.
3.6. Top Metaverse Coins 7-Day Change Analysis
Render, FLOKI, Axie Infinity, The Sandbox, and Decentraland are the top five Metaverse Coins on the basis of market cap. Render has the highest market cap of $3,961,011,301. FLOKI, Axie Infinity, and The Sandbox closely follow with $2,057,557,670, $1,064,252,244, and $1,009,956,073 market cap, respectively.
| Metaverse Coins | Market Cap | 7-Day Change |
| Render | $3,961,011,301 | -10.5% |
| FLOKI | $2,057,557,670 | +18.0% |
| Axie Infinity | $1,064,252,244 | -5.0% |
| The Sandbox | $1,009,956,073 | -0.9% |
| Decentraland | $814,803,203 | -1.0% |
Among the top five metaverse coins, only FLOKI shows a positive 7-day change; it records a change of +18.0%. Render, showing -10.5% change, registers the highest negative change. Axie Infinity showcases a change of -5.0%. Decentraland (-1.0% change) and The Sandbox (-0.9% change) only display moderate negative changes.
4. Crypto ETF Weekly Analysis
The crypto ETF weekly analysis covers Bitcoin Spot ETFs, Bitcoin Futures ETFs, and Ethereum Futures ETFs.
4.1. Bitcoin Spot ETF Price Change Analysis
GBTC, IBIT, FBTC, ARKB and BITB are the top five Bitcoin Spot ETFs based on Asset Under Management. GBTC marks the highest AUM of $24.33 billion. IBIT closely follows with an AUM of $17.24 billion.
| Bitcoin Spot ETFs | Price | Change | AUM |
| Grayscale (GBTC) | $58.02 | -1.36% | $24.33B |
| BlackRock (IBIT) | $37.15 | -1.38% | $17.24B |
| Fidelity (FBTC) | $57.02 | -1.43% | $9.90B |
| Ark/21 Shares (ARKB) | $65.22 | -1.27% | $2.85B |
| Bitwise (BITB) | $35.53 | -1.47% | $2.16B |
Among the top five Bitcoin Spot ETFs, none display positive changes. BITB shows the highest negative change of -1.47%. FBTC closely follows with -1.43%. IBIT and GBTC mark -1.38% and -1.36% change, respectively.
4.2. Bitcoin Futures ETF Price Change Analysis
BITO, XBTF, BTF, BITS, and ARKA are the top five Bitcoin Futures ETFs as per Asset Under Management.
| Bitcoin Futures ETFs | Price | Change | AUM |
| ProShares (BITO) | $26.49 | -1.30% | $598.78M |
| VanEck (XBTF) | $39.22 | +0.33% | $42.41M |
| Valkyrie (BTF) | $18.25 | -1.93% | $38.20M |
| Global X (BITS) | $64.10 | -0.94% | $26.10M |
| Ark/21 Shares (ARKA) | $62.17 | -1.52% | $8.10M |
Among the top five Bitcoin Futures ETFs, only XBTF displays a positive change of +0.33%. The highest negative change is shown by BTF. ARKA and BITO closely follow with -1.52% and -1.30% change, respectively. BITS marks a moderate negative change of -0.94%.
4.3. Ethereum Futures ETF Price Change Analysis
BITW, BTF, EFUT, EETH, and AETH are the top five Ethereum Futures ETFs based on Asset Under Management.
| Ethereum Futures ETFs | Price | Change | AUM |
| Bitwise (BITW) | $31.55 | -1.31% | $478.00M |
| Valkyrie (BTF) | $18.25 | -1.93% | $25.93M |
| VanEck (EFUT) | $24.16 | -1.88% | $7.84M |
| ProShares (EETH) | $63.87 | -2.86% | $6.43M |
| Bitwise (AETH) | $38.69 | -2.73% | $585.75K |
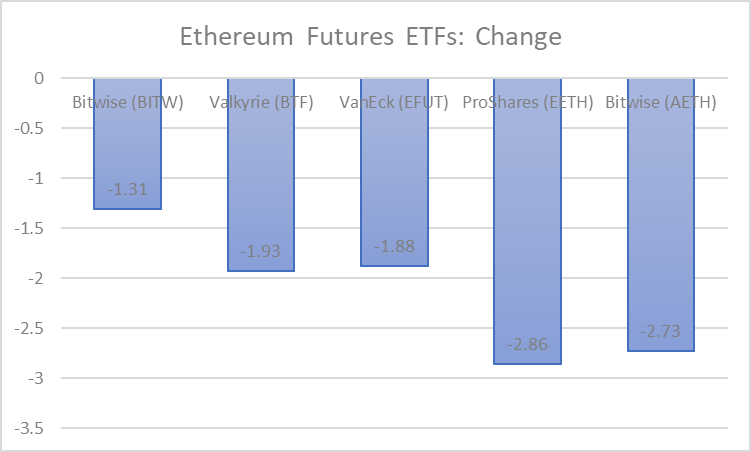
Among the top five Ethereum Futures ETFs, none record positive changes. The highest negative change is displayed by EETH (-2.86%). AETH closely follows with -2.73%. BTF and EFUT record -1.93% and -1.88% change, respectively. BITW registers a change of -1.31%.
5. DeFi Protocols Weekly Analysis
Lido, EigenLayer, AAVE, Maker and JustLend are the top five DeFi protocols as per Total Value Locked.
| DeFi Protocols | TVL | 7-Day Change |
| Lido | $28.549B | +0.12% |
| EigenLayer | $14.919B | -0.67% |
| AAVE | $10.936B | +2.77% |
| Maker | $8.25B | +0.61% |
| JustLend | $6.431B | +4.07% |

Among the top five DeFi Protocols, all of them show positive 7-day changes except Eigen Layer, which records a negative change of -0.67%. The highest positive change is shown by JustLend, which registers a change of +4.07%. AAVE follows with a change of +2.77%. Maker and Lido display moderate positive changes of +0.61% and +0.12%.
6. Crypto Exchange Weekly Analysis
6.1. Top Crypto Centralised Exchanges
Based on monthly visits, Binance, Coinbase Exchange, Bybit, OKK, and WhiteBIT are the top five crypto centralised exchanges.
| Crypto Centralised Exchanges | Monthly Visits | Trust Score |
| Binance | 101M | 9/10 |
| Coinbase Exchange | 65.7M | 10/10 |
| Bybit | 39.1M | 10/10 |
| OKK | 30.5M | 10/10 |
| WhiteBIT | 22.9M | 8/10 |
Binance records the highest monthly visit of 101M. Coinbase Exchange follows with 65.7M. Bybit and OKK record 39.1M and 30.5M monthly visits. WhiteBIT registers 22.9M monthly visits.
Among the top crypto centralised exchanges, at least three, Coinbase Exchange, Bybit and OKK have the impressive trust score of 10/10. Binace has a trust score of 9/10, and WhiteBIT has a score of 8/10.
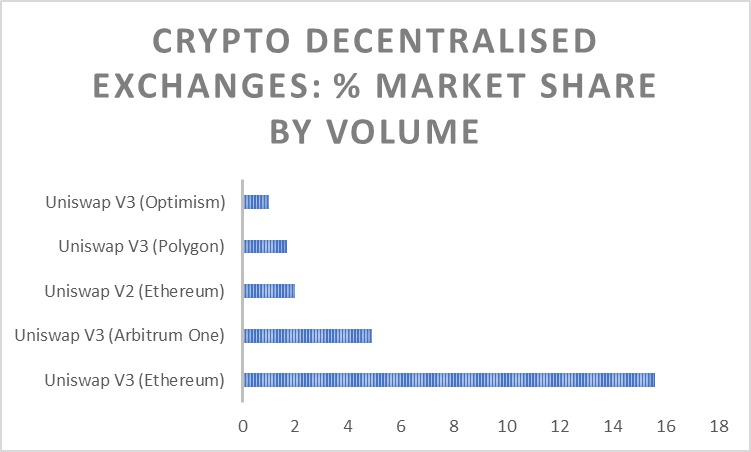
6.2. Top Crypto Decentralised Exchanges
Uniswap V3 (Ethereum), Uniswap V3 (Arbitrum One), Uniswap V2 (Ethereum), Uniswap V3 (Polygon), and Uniswap V3 (Optimism) are the top five crypto decentralised exchanges on the basis of Market Share by Volume.
| Crypto Decentralised Exchanges | % Market Share by Volume | 24-Hour Volume |
| Uniswap V3 (Ethereum) | 15.6% | $875,859,638 |
| Uniswap V3 (Arbitrum One) | 4.9% | $275,170,379 |
| Uniswap V2 (Ethereum) | 2.0% | $113,110,402 |
| Uniswap V3 (Polygon) | 1.7% | $92,957,905 |
| Uniswap V3 (Optimism) | 1.0% | $56,123,372 |
Uniswap V3 (Ethereum) has the highest market share by volume of 15.6%. Uniswap V3 (Arbitrum One) and Uniswap V2 (Ethereum) follow with 4.9% and 2.0%, respectively. Uniswap V3 (Polygon) marks 1.7% market share by volume, and Uniswap V3 (Optimism) records the market share by volume of 1.0%.
6.3. Top Crypto Derivative Exchanges
Binance (Futures), Bybit(Futures), BYDFi (Futures), Bitget Futures and Deepcoin (Derivatives) are the top five crypto derivative exchanges by 24-hour open interest.
| Crypto Derivative Exchanges | 24-Hour Open Interest | 24-Hour Volume |
| Binance (Futures) | $17,732,368,644 | $56,137,133,472 |
| Bybit (Futures) | $11,931,914,631 | $17,252,999,974 |
| BYDFi (Futures) | $9,735,334,808 | $21,186,587,860 |
| Bitget Futures | $9,455,430,822 | $16,609,950,961 |
| Deepcoin (Derivatives) | $9,330,882,218 | $7,809,727,287 |
Binance (Futures) displays the highest 24-hour Open Interest of $17,732,368,644. Bybit (Futures) and BYDFi (Futures) follow with $11,931,914,631 and $9,735,334,808, respectively. Bitget Futures and Deepcoin (Derivatives) register $9,455,430,822 and $9,330,882,218 open interest, respectively.
Among the top five crypto derivatives exchanges, Binance (Futures) shows the highest 24-hour Volume of $56,137,133,472. BYDFi (Futures) follows with $21,186,587,860 volume. Bybit (Futures) and Bitget Futures register $17,252,999,974 and $16,609,950,961 in volume, respectively.
7. NFT Marketplace Weekly Analysis
Blur, Blur Aggregator, Cryptopunks, X2Y2, and Gem are the top five NFT Marketplaces by Market Share. Blur has the highest market share of 64.32%. Blur Aggregator and Cryptopunks follow with 24.87% and 3.25% market share respectively.
| NFT Marketplaces | Market Share | Volume Change (Change of last 7-D Volume over the Previous 7-D Volume) |
| Blur | 64.32% | -1.41% |
| Blur Aggregator | 27.87% | -5.86% |
| Cryptopunks | 3.25% | -1.20% |
| X2Y2 | 2.58% | -12.94% |
| Gem | 0.73% | -34.97% |
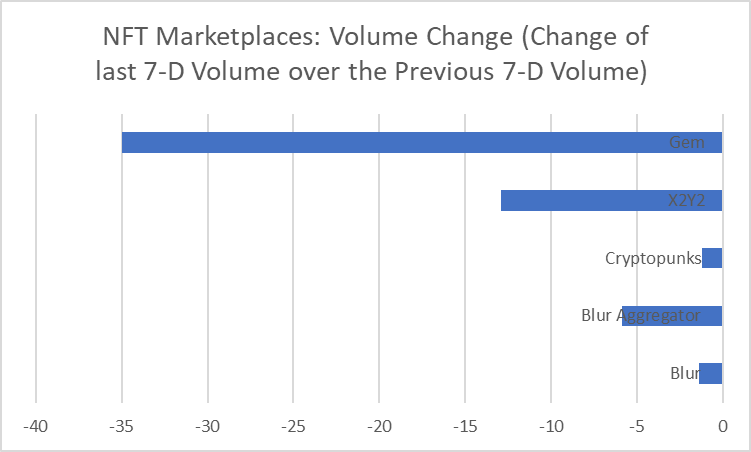
Among the top five NFT Marketplaces, none shows positive volume changes. The highest negative volume change is shown by Gem, which records a change of -34.97%. X2Y2 follows with -12.94%. Blur Aggregator displays a change of -5.86%. Blur and Cryptopunks mark changes of -1.41% and -1.20%, respectively.
7.1. Top NFT Collectibles This Week
CryptoPunks #741, $ORDI BRC-20 NFTs #88159, CryptoPunks #3619, Lasogette NFT #802, and Bored Ape Yacht Club #7616 are the top NFT collectibles based on Price.
| NFT Collectibles | Price |
| CryptoPunks #741 | $792,046.13 |
| $ORDI BRC-20 NFTs #88159 | $681,497.38 |
| CryptoPunks #3619 | $627,990.88 |
| Lasogette NFT #802 | $273,036.16 |
| Bored Ape Yacht Club #7616 | $248,797.03 |
CryptoPunks #741 is priced at $792,046.13. $ORDI BRC-20 NFTs #88159 costs $681,497.38. CryptoPunks #3619, Lasogette NFT #802, and Bored Ape Yacht Club #7616 are priced at $627,990.88, $273,036.16, and $248,797.03, respectively.
8. Web3, Blockchain & Crypto Funding Analysis
8.1. Crypto Fundraising Trend
| Week | Funds Raised | Number of Fundraising Rounds |
| May 13-19, 2024 | $155.40M | 25 |
| May 6-12, 2024 | $149.60M | 37 |
This week, nearly $155.40M has been raised so far. It has already crossed the previous week’s $149.60M.
8.2. Most Active Investors This Week
Animoca Brands, P2 Ventures (Polygon Ventures), Unicorn Factory Ventures, Double Peak and NXGen are the most active investors this week, based on Deals.
| Investors (or Fund’s Name) | Deals (12 May – 17 May, 2024) | Investments | Lead Investments |
| Animoca Brands | 4 | 2 | 2 |
| P2 Ventures (Polygon Ventures) | 3 | 3 | 0 |
| Unicorn Factory Ventures | 2 | 2 | 0 |
| Double Peak | 2 | 2 | 0 |
| NXGen | 2 | 1 | 1 |
Animoca Brands records the highest number of deals of 4; out of these deals, 2 are normal investments and 2 are lead investments. P2 Ventures (Polygon Ventures) follows with three deals – all of them are normal investments. Unicorn Factory Ventures and Double Peak register 2 deals each – none of them are lead investments. Notably, NXGen marks one normal investment and one lead investment – a total of two deals.
8.3. Crypto Fundraising By Category
Blockchain Infrastructure, Blockchain Services, CeFi, Chain, DeFi, GameFi, and Social are the categories raised funds this week.
| Category | Number of Fundraising Rounds (May 13-19, 24) | Funds Raised |
| Blockchain Infrastructure | 4 | $40.05M |
| Blockchain Services | 3 | $6.20M |
| CeFi | 1 | $2.70M |
| Chain | 1 | $15.00M |
| DeFi | 9 | $69.55M |
| GameFi | 5 | $15.10M |
| Social | 2 | $6.80M |
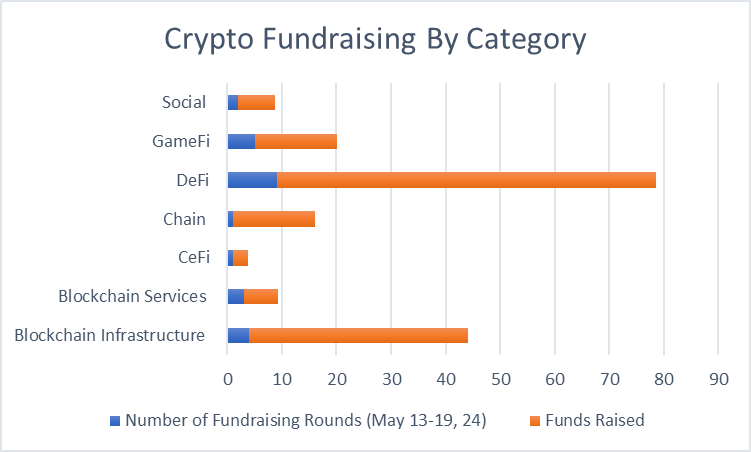
DeFi raised the highest amount of $69.55M. Blockchain Infrastructure, GameFi and Chain follow with $40.05M, $15.10M, and $15.00M.
8.4. Top Crypto Investment Locations
Apart from Undisclosed, the United States, Singapore and France are the top crypto investment locations, on the basis of funds raised.
| Investment Location | Funds Raised (May 12 – 17, 2024) | Funds Raised % | Number of Rounds |
| Undisclosed | $87.10M | 56% | 16 |
| United States | $56.20M | 36% | 5 |
| Singapore | $9.50M | 6% | 2 |
| France | $2.60M | 2% | 1 |
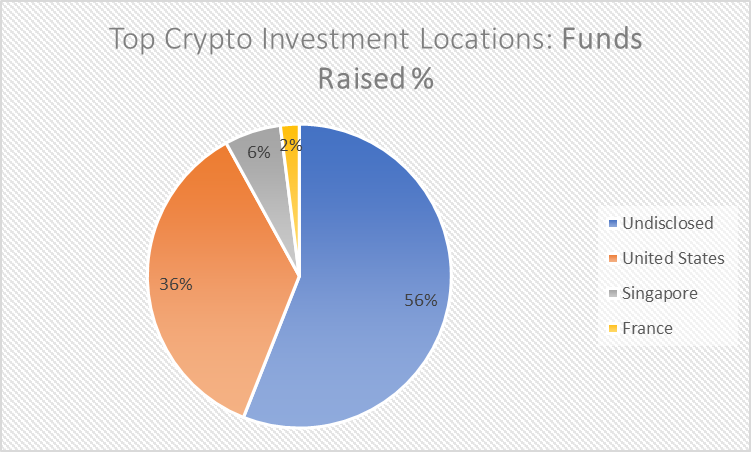
When the category of undisclosed raised over $87.10M, the US amassed an amount of $56.20M. Singapore and France collected $9.50M and $2.60M, respectively.
8.5. Most Active Crypto VC Jurisdictions
The US, the UK, the UAE, Singapore and China are the most active crypto venture capital jurisdictions.
| Crypto VC Jurisdiction | Number of Projects (May 12 – 17, 2024) |
| United States | 53 |
| United Kingdom | 11 |
| United Arab Emirates | 11 |
| Singapore | 6 |
| China | 6 |
The US registers the highest number of projects 53. The United Kingdom and the United Arab Emirates follow with 11 each. Singapore and China recorded 6 each.
9. Web 3, Blockchain & Crypto Hack Updates
The total value of hacked is $8.75 billion. The total value hacked in DeFi is $5.92B and Total Value Hacked in Bridges is $2.83 billion.
| Total Value Hacked | $8.75B Total Value Hacked in DeFi$5.92BTotal Value Hacked in Bridges $2.83B |
| Project Name | Amount Lost | Date |
| Sonne Finance | $20M | 15 May, 2024 |
A hack was reported in Sonne Finance on 15th May, 2024 – the first reported this month. A huge amount of $20 million was lost due to the hack.
Endnote
This report provides a comprehensive analysis of the current performance of various blockchains and cryptocurrencies, including Bitcoin, Altcoins, Stablecoins, AI Coins, Memecoins and Metaverse. It highlights trending coins, top gainers and losers, and delves into Crypto ETFs such as Bitcoin Spot ETFS, Bitcoin Futures ETFs, and Ethereum Futures ETFs. Additionally, it examines centralised, decentralised, and derivatives crypto exchanges, DeFi protocols, and NFT marketplaces. The report also covers crypto fundraising activities, prominent investors, key investment locations, and notable crypto hacks reported lately.