Daily Market Review: BTC, ETH, FLOKI, PEPE, AR
Markets have entered a consolidation period, as seen from the minimal price movements in today’s session. Looking at the global market cap, we see that it stood at $2.35T, representing a 0.15% increase over the last 24 hours, while the trading volume jumped by 9% within the same period to trade at $89.09B.
Bitcoin Price Review
Bitcoin (BTC) is among the few gainers in today’s session, as evidenced by its price movements. Looking at an in-depth analysis, we see that the chart shows that Bitcoin is trading near the upper Bollinger Band, indicating that it is bullish. The bands are widening, suggesting increased volatility. The Bitcoin price has moved above the middle band (20-period moving average), which often acts as a support level in an uptrend.
On the other hand, the RSI is at 67.45, close to the overbought territory (above 70). This suggests the asset might experience a short-term pullback or consolidation before continuing its upward trend. However, the RSI is not yet overbought, indicating there might still be some room for upward movement. As of press time, the Bitcoin price stood at $66,103, a 0.12% increase from its previous 24-hour price.

Ethereum Price Review
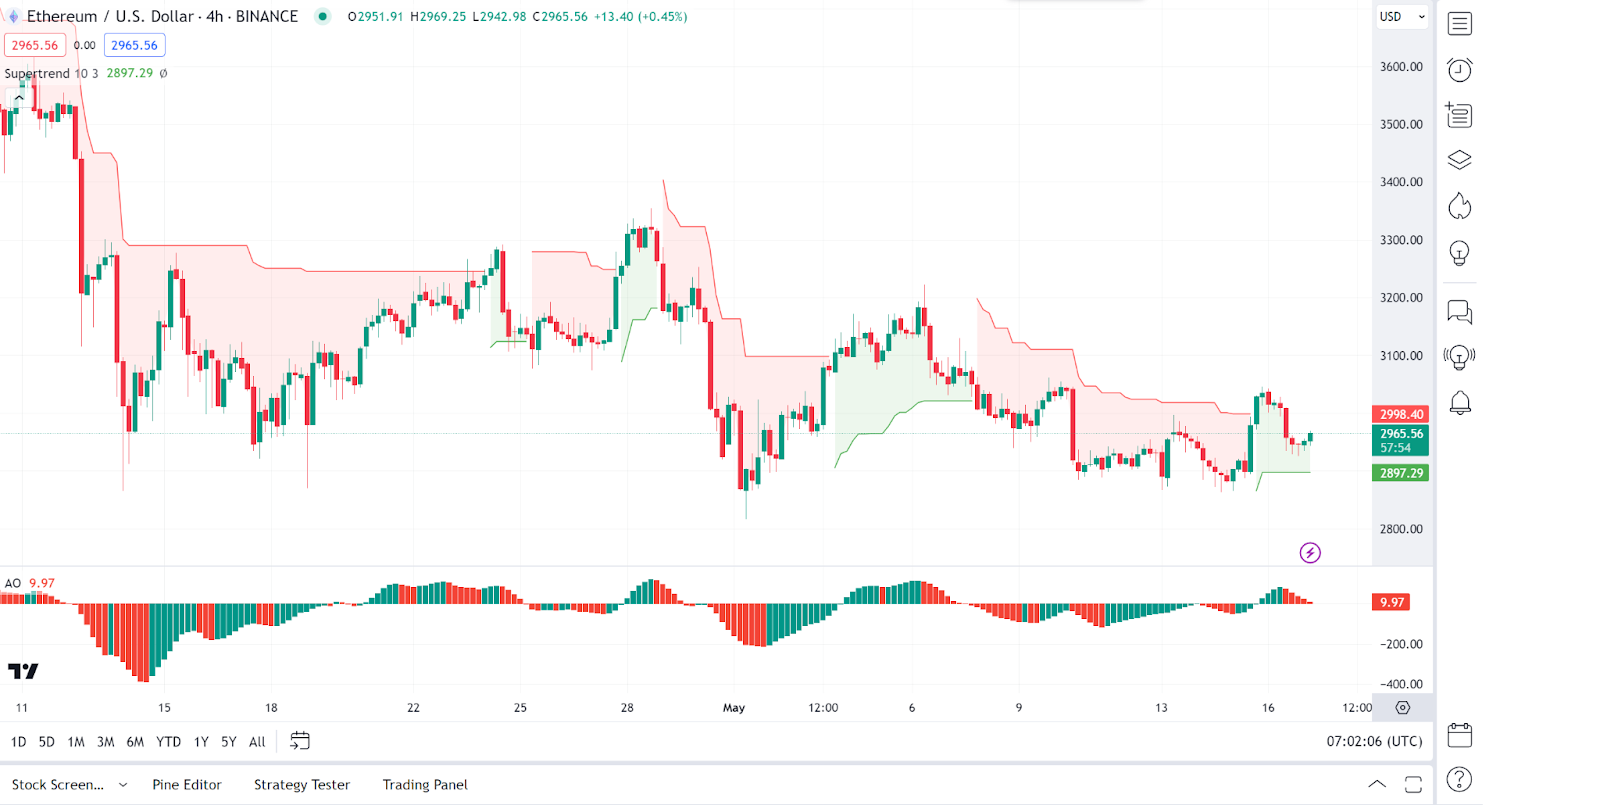
Ethereum (ETH) is now retracing after its previous pump, evidenced by its price movements in today’s session. An in-depth analysis shows that the Supertrend indicator is currently green, indicating a bullish trend. Ethereum’s price is above the green line, acting as a support level. The Ethereum price action suggests that the trend is strong as it consistently trades above this support.
On the other hand, the Awesome Oscillator shows positive momentum, as it is mostly green and above the zero line. This confirms the bullish trend seen with the Supertrend indicator. However, some red bars indicate that short-term bearish pressure might occur. As of press time, the Ethereum price stood at $66,103, a 0.12% decrease from its previous 24-hour price.
Floki Price Review
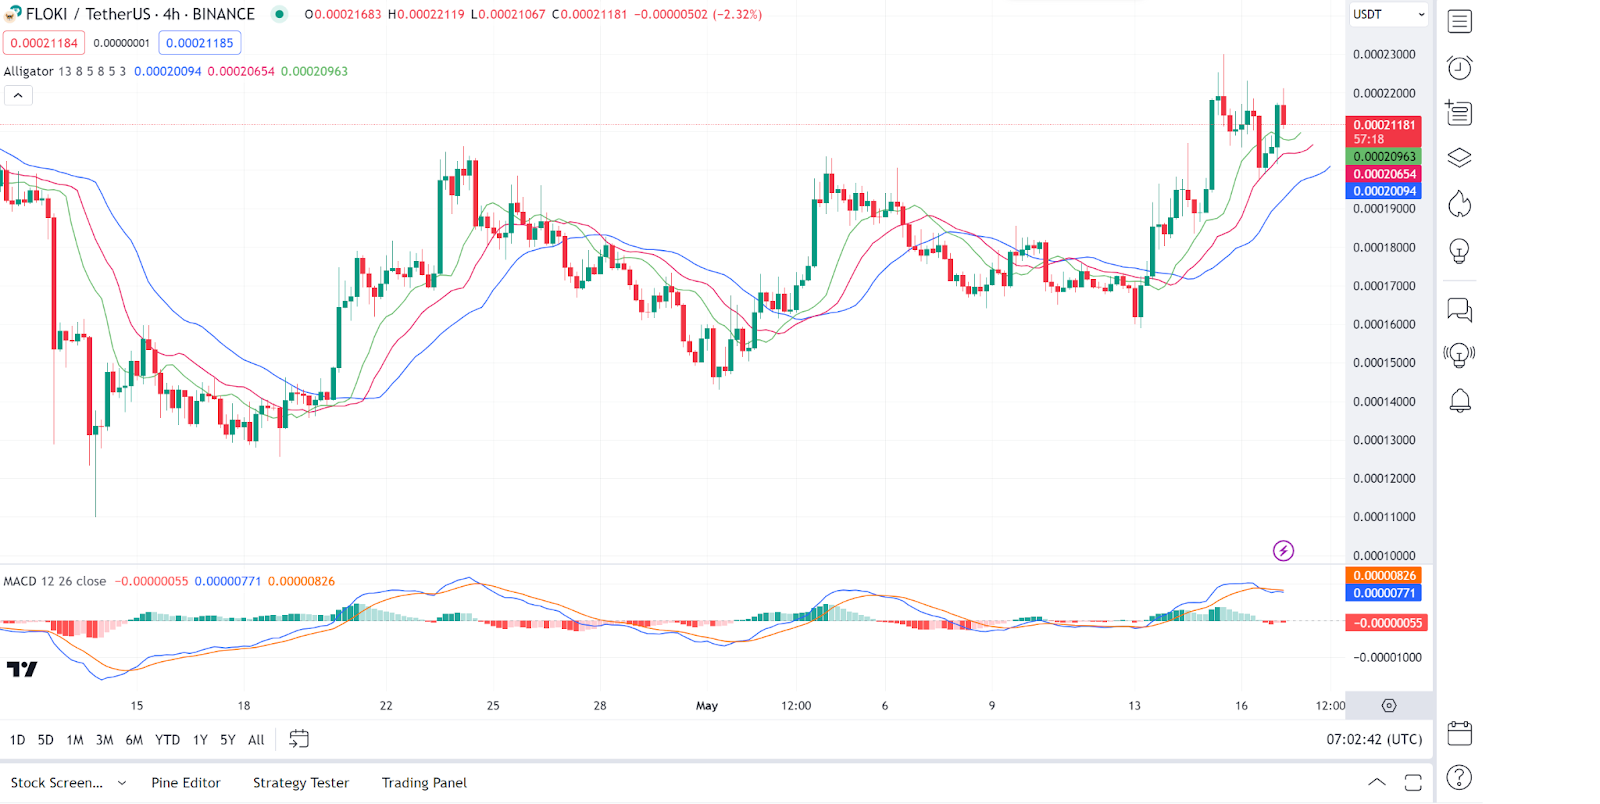
Floki (FLOKI) also faces corrections in today’s session, as evidenced by its price movements. Looking at in-depth analysis, we see that the Alligator’s jaw (blue line), teeth (red line), and lips (green line) indicate a bullish trend as they are in alignment with the Floki price above them. The last red candlestick, however, could mean changing momentum.
The MACD line is below the signal line, confirming the bearish momentum causing the corrections. A histogram of green bars indicates that the bullish momentum is increasing. As of press time, the Floki price stood at $66,103, a 0.12% decrease from its previous 24-hour price.
Pepe Price Review
Pepe (PEPE) is also facing corrections today as its earlier pump. An in-depth analysis shows that the Pepe price trades above the cloud, indicating a bullish trend. The leading span A is above leading span B, further confirming the bullish trend. The cloud is thin, suggesting a possible period of low volatility ahead.
On the other hand, the Woodies CCI is currently at 9.32, indicating that the market is in a neutral zone. The recent movements suggest that there might be some consolidation before the next move. As of press time, the Pepe price stood at $0.00001021, a 3.89% decrease from its previous 24-hour price.

Arweave Price Review
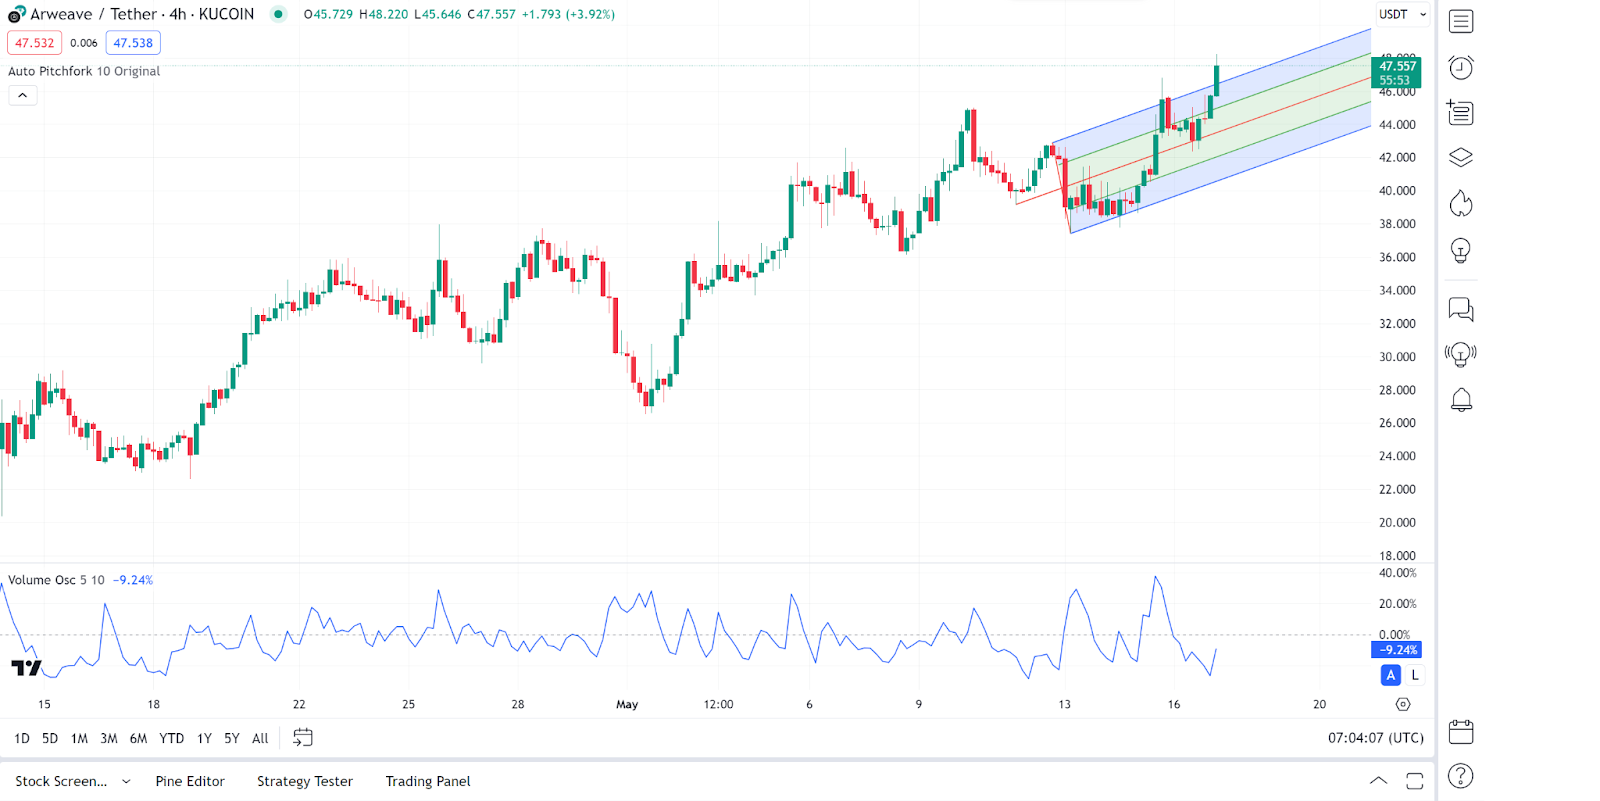
However, Arweave (AR) is among the gainers today, as seen from the price movements. An in-depth analysis shows that the Arweave price follows the pitchfork’s upper trendline, suggesting a strong bullish trend. The Arweave price also makes higher highs and lows, reinforcing the bullish sentiment.
On the other hand, the Volume Oscillator shows a negative reading of -9.24%, indicating that the recent price moves are happening on lower volume. This might suggest a potential slowdown or consolidation in the trend. As of press time, the Arweave price stood at $48.21, a 10.92% increase from its previous 24-hour price.