Chainlink’s Price Roars: LINK Bullish Run Ahead as Market Frenzy Builds
Key Takeaways
- Chainlink remained strong above $12.00 and the 50-week simple moving average (blue).
- LINK price is still following an important parabolic curve with support at $14.20 on the weekly chart.
- The price is up nearly 15% and might attempt an upside break above the $17.40 resistance zone.
NEW DELHI (CoinChapter.com) — Chainlink (LINK) is seeing a fresh rally above the $16.00 zone. A close above $17.40 could signal a strong drift.
Chainlink Price Restarts Increase
In the last analysis with a weekly chart, we discussed the importance of the $12.00 support and the 50-week simple moving average (blue) for Chainlink. The bears made more than three attempts to push the price below the $12.00 support but failed.
The bulls were strong near the $12.00 zone and protected a weekly close below the 50-week simple moving average (blue). Besides, the price is still following an important parabolic curve with support at $14.20 on the weekly chart. As a result, a support base was formed, and LINK price started a fresh increase, outperforming Bitcoin.
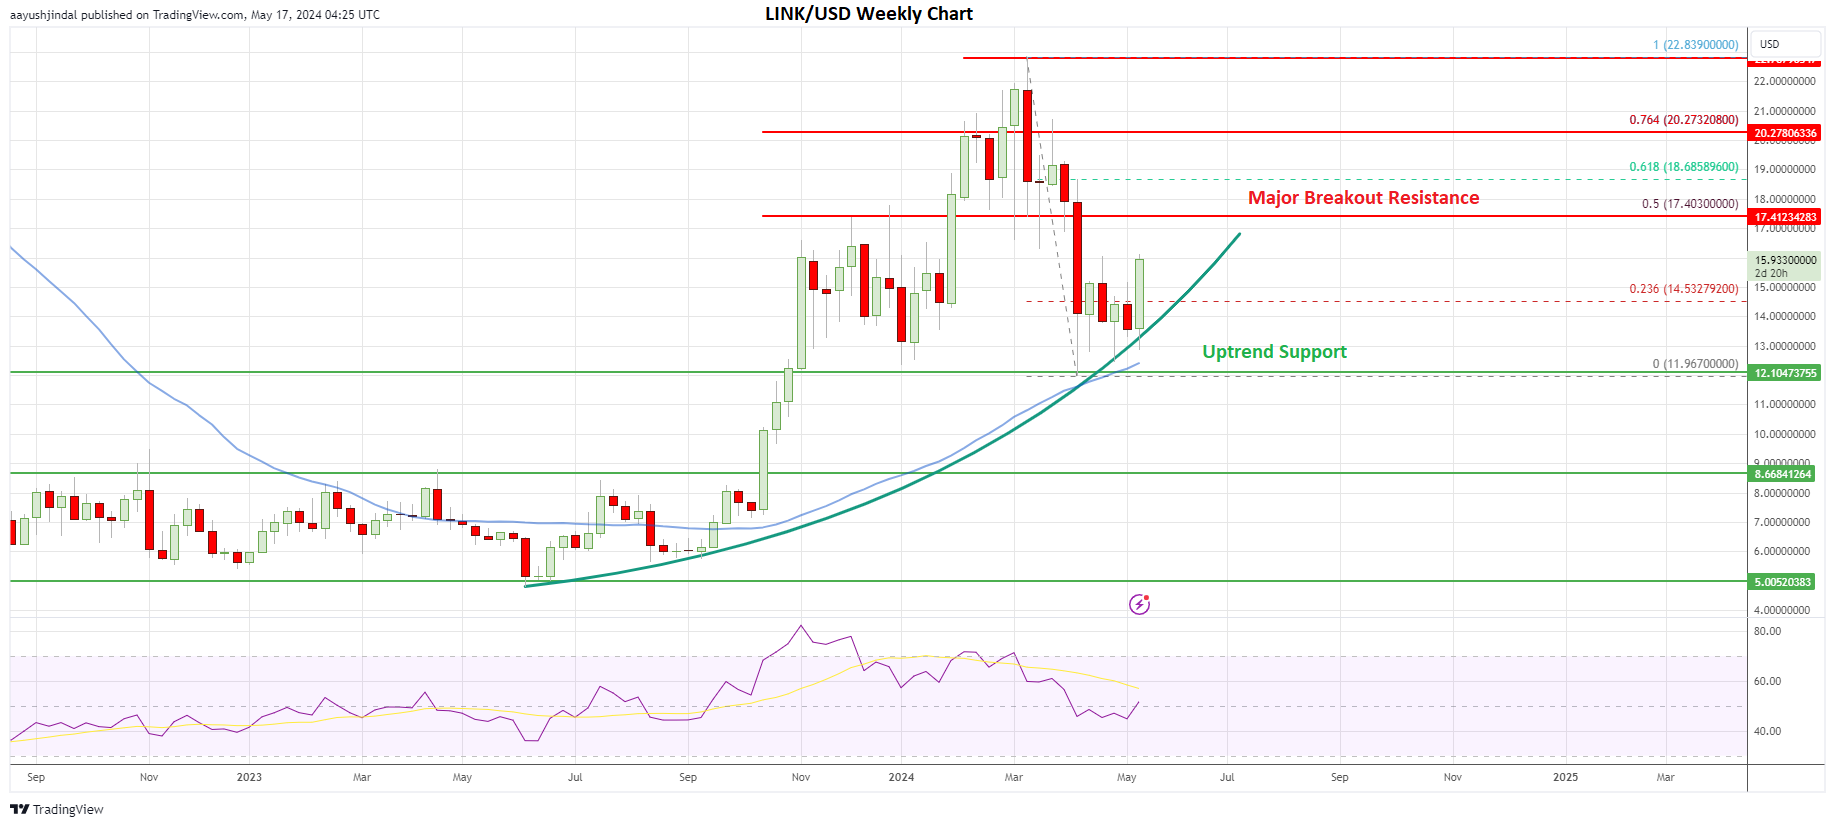
The last swing low was at $11.96, and the price is now trading above the 23.6% Fib retracement level of the downward wave from the $22.83 swing high to the $11.96 low. Recently, Chainlink shared results of a new Smart NAV industry pilot between them, the DTCC and 10 of the world’s largest financial institutions. The pilot was designed to evaluate the feasibility and industry value of delivering a DLT-based price and rate dissemination solution.
We’re excited to share the results of a new Smart NAV industry pilot between @The_DTCC, Chainlink, and 10 of the world’s largest financial institutions that delivered key mutual fund data onchain.
— Chainlink (@chainlink) May 16, 2024
Full report: https://t.co/ob3K0s4g86
The significance for fund tokenizationpic.twitter.com/74zocXa2s0
Chainlink is up nearly 15% in a day and the current weekly candle is signaling a strong bullish momentum. LINK price is now approaching the $16.00 resistance. The first major resistance on the upside sits at $17.40. It represents a multi-touch zone and coincides with the 50% Fib retracement level of the downward wave from the $22.83 swing high to the $11.96 low.
LINK price is now approaching the $16.00 resistance. The first major resistance on the upside sits at $17.40. It represents a multi-touch zone and coincides with the 50% Fib retracement level of the downward wave from the $22.83 swing high to the $11.96 low.
A close above the $17.40 resistance could set the pace for a larger increase. The next key resistance is near the $20.00 level. If the bulls push the price above $20.00, there could be a drift toward the $22.80 barrier. Any more gains might call for a move toward $25.00.
LINK Could Retest $12?
If Chainlink fails near $16.00 or $17.40, there could be a fresh decline. Immediate support is near the $14.20 level and the curve zone. The next major support is at $13.00 (a multi-touch zone).
The main support is still near the 50-week simple moving average (blue) and $12.00. A weekly close below the $12.00 support could signal a medium-term top. In the stated case, the price might decline toward the $8.20 pivot level.
Overall, Chainlink’s LINK price is signaling a strong bullish momentum above $15.00 and the 50-day simple moving average (blue). A close above $17.40 might trigger a major surge in the coming weeks.
The post Chainlink’s Price Roars: LINK Bullish Run Ahead as Market Frenzy Builds appeared first on CoinChapter.