Bitcoin Surges 5% as April Inflation Eases to 3.4%
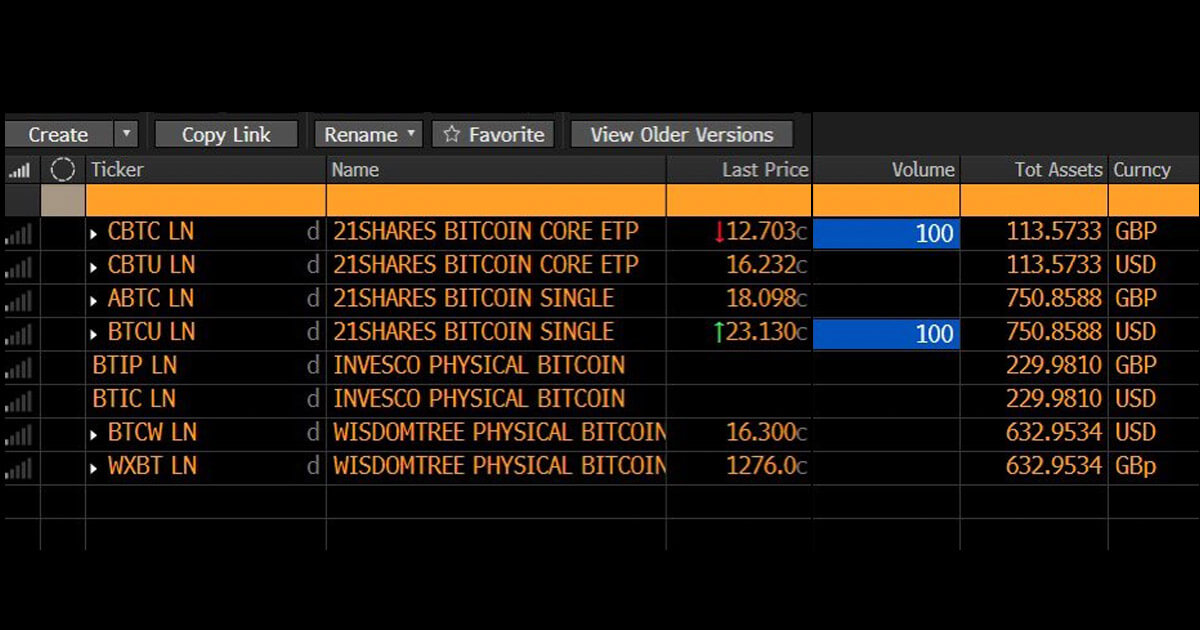
Bitcoin experienced a notable 5% surge, potentially driven by investors’ sentiment towards the latest inflation figures. CPI inflation data reveal a slight easing of inflation in April, with the annual rate decelerating to 3.4%.
According to the Bureau of Labor Statistics, declines in grocery and used car prices offset another rise in rent and gasoline costs. After accelerating unexpectedly in the first quarter, this report signifies a step forward in the battle against stubbornly high inflation.
Core Inflation Reaches Three-Year Low, Fueling Speculation
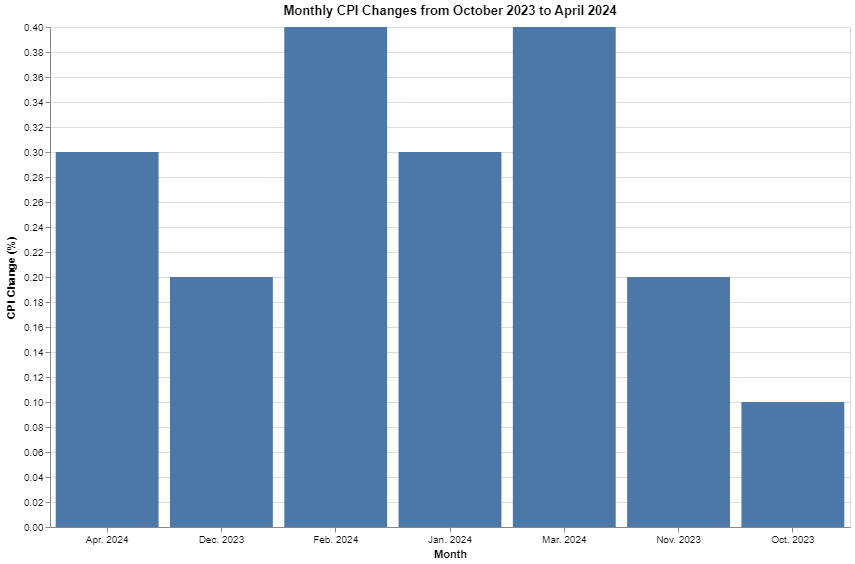
While the headline inflation figure provided some relief, investors closely monitored the core inflation rate, which excludes volatile food and energy components. This closely watched metric increased by 0.3% in April, down from the 0.4% rise in March. Consequently, the annual core inflation rate dropped from 3.8% to 3.6%, marking its lowest level since April 2021.
The moderation in core inflation has fueled speculation among market participants regarding the Federal Reserve’s next move on interest rates. Some analysts suggest that the central bank may consider pausing its aggressive rate hike cycle, given the progress made in taming inflationary pressures.
According to Barclays’ projections, annual inflation could slow to 3.1% by December, with the core CPI measure falling to 3.3%. However, these levels would still exceed the Fed’s target of 2%, leaving policymakers with a delicate balancing act.
Bitcoin Showcases Strength as Economic Uncertainties Persist
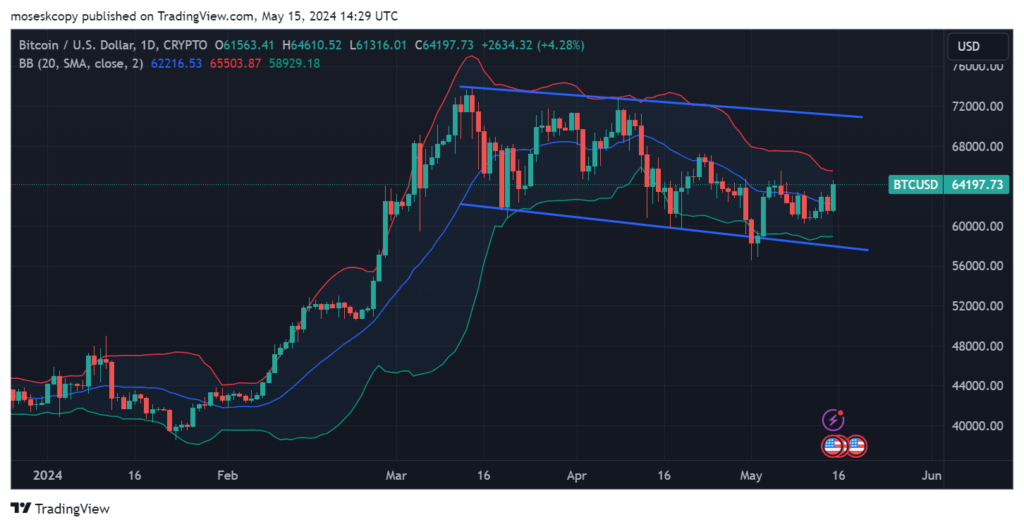
Bitcoin’s recent surge suggests resilience against economic uncertainties. The Relative Strength Index (RSI) indicates potential support against further declines. Bitcoin defended the ascending trendline, aiming to recapture the $63,354 threshold. A breakthrough at $65,500 on the four-hour time frame could signal a market structure shift. This may drive Bitcoin towards the $70,000 psychological level.

In a bullish scenario, Bitcoin could revisit its all-time high of $73,777. The daily timeframe shows Bitcoin trapped in a descending channel for two months. A recent fake breakout hints at momentum recovery, suggesting potential upward movement.
The post Bitcoin Surges 5% as April Inflation Eases to 3.4% appeared first on CoinChapter.