Crypto Price Analysis: BTC Dominates as PEPE, TRUMP, SAGA, GME Trail Behind
The global cryptocurrency market continues to exhibit dynamic shifts, with the total market capitalization standing at an impressive $2.38 trillion, marking a significant 5.75% increase in just the past day. Amidst this bustling market activity, various cryptocurrencies are experiencing notable fluctuations in price and trading volume, offering both opportunities and challenges for investors and traders alike.
In this comprehensive analysis, we delve into the recent price movements and technical indicators of key cryptocurrencies, providing insights into their current market sentiment and potential future trajectories. From the soaring ascent of Bitcoin (BTC) to the nuanced fluctuations of altcoins like Pepe (PEPE) and Saga (SAGA), each cryptocurrency presents a unique narrative within the broader crypto landscape.
Bitcoin (BTC) Price Analysis
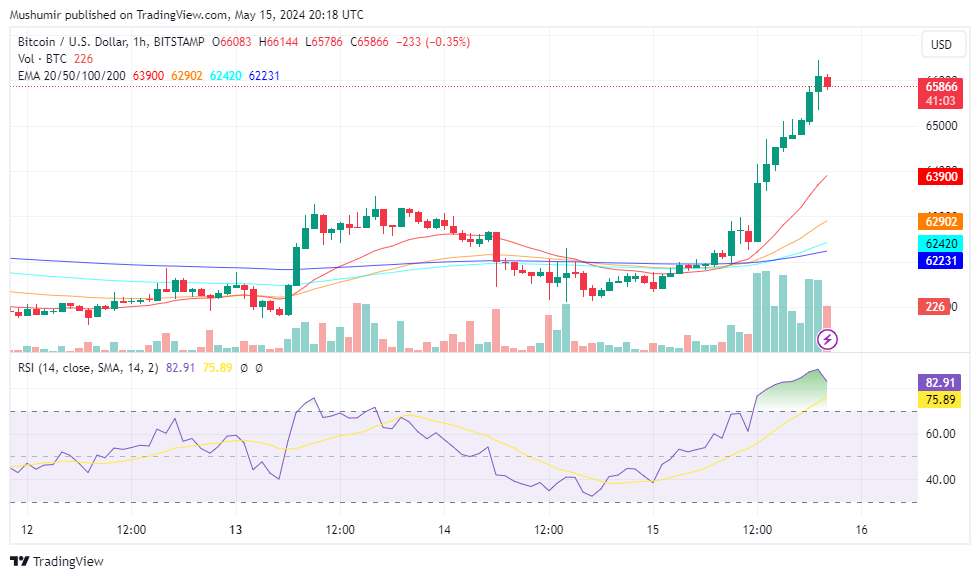
Bitcoin (BTC) has experienced a notable surge in price over the last 24 hours, with its value rising by 6.89% to reach $65,848. This uptrend is supported by a significant increase in trading volume, which has surged by 31.34% to $37.29 billion, indicating heightened market activity and investor interest.
In terms of technical indicators, the Relative Strength Index (RSI) for BTC is currently at 57, suggesting a neutral to slightly bullish sentiment among traders. The RSI, which measures the magnitude of recent price changes to evaluate overbought or oversold conditions, indicates that Bitcoin is neither significantly overbought nor oversold at the moment.
Furthermore, Bitcoin’s price is trading above the 200-day Simple Moving Average (SMA), which is considered a strong bullish signal by technical analysts. The 200-day SMA represents the average closing price of BTC over the past 200 days and is often used as a long-term trend indicator. The fact that Bitcoin is trading above this moving average suggests that the overall trend is bullish, providing additional confirmation of the positive momentum in the market.
In the end, Bitcoin’s price analysis indicates a bullish outlook in the short to medium term, supported by both price action and trading volume. However, traders should continue to monitor key levels and indicators, such as the RSI and moving averages, for any signs of potential reversal or further bullish continuation.
Pepe (PEPE) Price Analysis
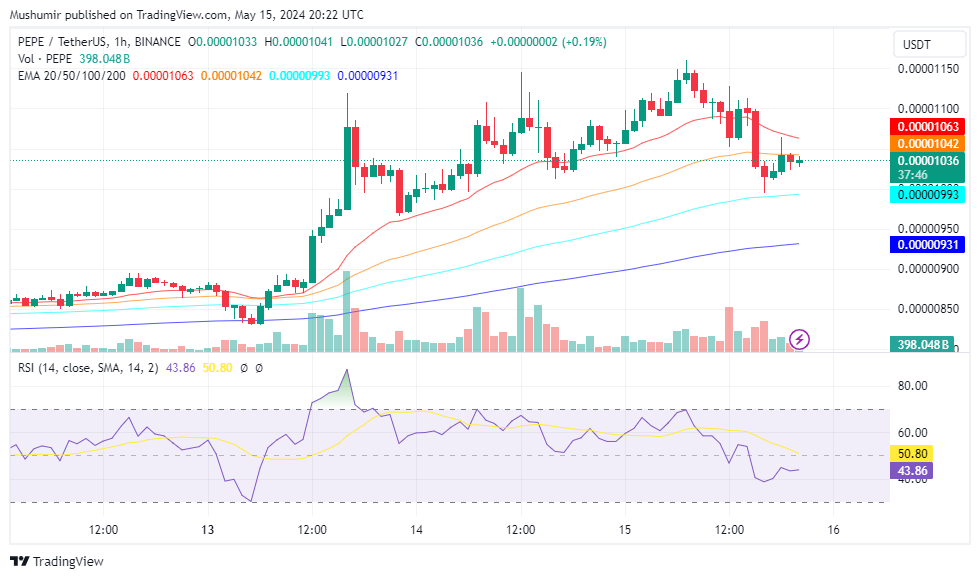
Pepe (PEPE) has experienced a slight decline in price over the last 24 hours, with its value decreasing by 3.06% to reach $0.00001037. This downward movement is accompanied by a decrease in trading volume, which has dropped by 24.96% to $2.89 billion, indicating reduced market activity and potentially waning investor interest.
Analyzing the technical indicators, the Relative Strength Index (RSI) for PEPE is currently at 70.41, indicating a bearish sentiment among traders. An RSI above 70 typically suggests that an asset may be overbought and could potentially see a correction in price. Therefore, the elevated RSI for Pepe signals caution for traders, as it suggests a possible reversal or consolidation in the near term.
Despite the bearish sentiment indicated by the RSI, Pepe is trading above the 200-day Simple Moving Average (SMA), which stands as a bullish sign. This indicates that the long-term trend for PEPE tokens remains positive, providing some reassurance to investors amidst the short-term price fluctuations.
In essence, Pepe’s price analysis reflects a mixed outlook, with a short-term bearish sentiment indicated by the RSI and a long-term bullish trend supported by the 200-day SMA. Traders should remain vigilant and monitor key levels and indicators for potential shifts in market sentiment and price direction.
MAGA (TRUMP) Price Analysis
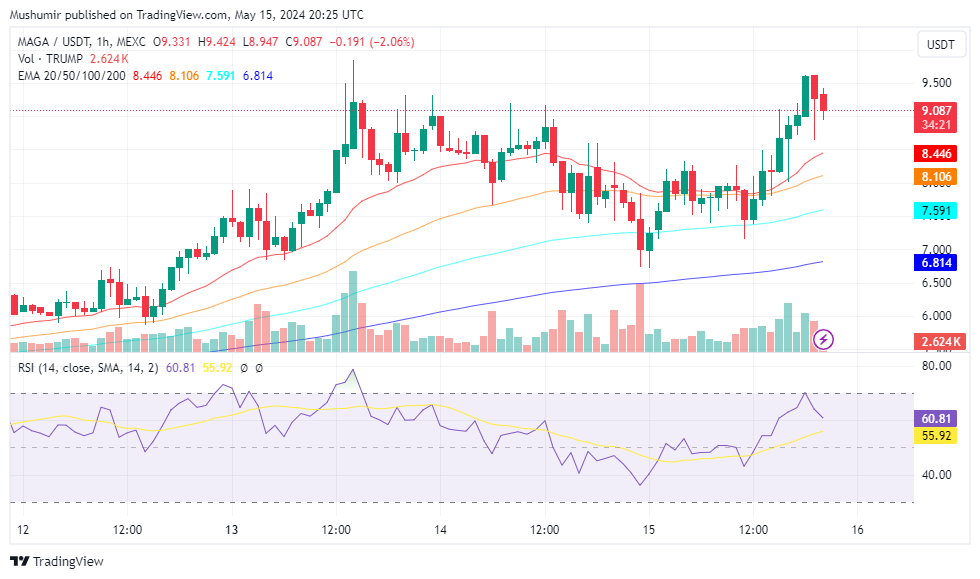
MAGA (TRUMP) has demonstrated significant bullish momentum over the past 24 hours, with its price surging by 17.01% to reach $9.00. This remarkable uptick in value is complemented by a modest increase in trading volume, which has risen by 5.01% to $16,401,004, indicating sustained interest and activity in the market.
Examining the technical indicators, the Relative Strength Index (RSI) for TRUMP currently stands at 66.037, indicating a neutral to slightly overbought zone. An RSI above 70 typically suggests that an asset may be overbought and could potentially see a correction in price. While TRUMP’s RSI is within this range, it is still below the threshold of 70, signaling that the asset may be slightly overbought but not to an extreme extent.
Furthermore, TRUMP is trading above the 20-day Simple Moving Average (SMA), which is considered a bullish signal by technical analysts. The 20-day SMA represents the average closing price of TRUMP over the past 20 days and is often used to gauge short-term trends. The fact that TRUMP is trading above this moving average indicates positive momentum in the short term, reinforcing the bullish sentiment observed in the price action.
Overall, TRUMP presents a bullish outlook in the short term, supported by both price appreciation and trading volume. However, traders should remain cautious of the slightly overbought conditions indicated by the RSI and continue to monitor key levels and indicators for potential shifts in market sentiment and price direction.
Saga (SAGA) Price Analysis
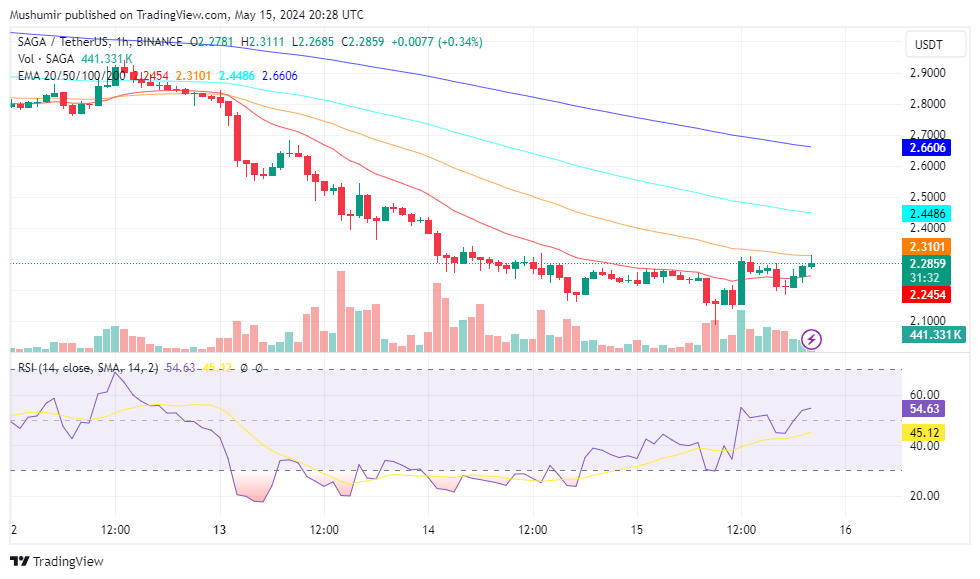
Saga (SAGA) has experienced a modest uptick in price over the last 24 hours, with its value increasing by 1.58% to reach $2.28. However, this upward movement is accompanied by a notable decrease in trading volume, which has declined by 25.28% to $67,793,827, suggesting a potential decrease in market participation and investor interest.
Analyzing the technical indicators, the Relative Strength Index (RSI) for Saga is currently at 23.7156, indicating a buy zone. An RSI below 30 typically suggests that an asset may be oversold and could potentially see a rebound in price. Therefore, the low RSI for Saga indicates that it may be oversold and could potentially be undervalued, presenting a buying opportunity for investors.
However, despite the bullish signal from the RSI, Saga is trading below the 20-day Simple Moving Average (SMA), which is considered a bearish sign. The 20-day SMA represents the average closing price of Saga over the past 20 days and is often used to identify short-term trends. The fact that Saga is trading below this moving average suggests a potential downtrend in the short term, highlighting the possibility of further price declines.
Saga’s price analysis reflects a mixed outlook, with a short-term bullish signal from the RSI indicating potential buying opportunities, but a bearish indication from trading below the 20-day SMA. Traders should exercise caution and closely monitor price movements and key indicators for confirmation of a trend reversal or continuation.
GameStop (GME) Price Analysis
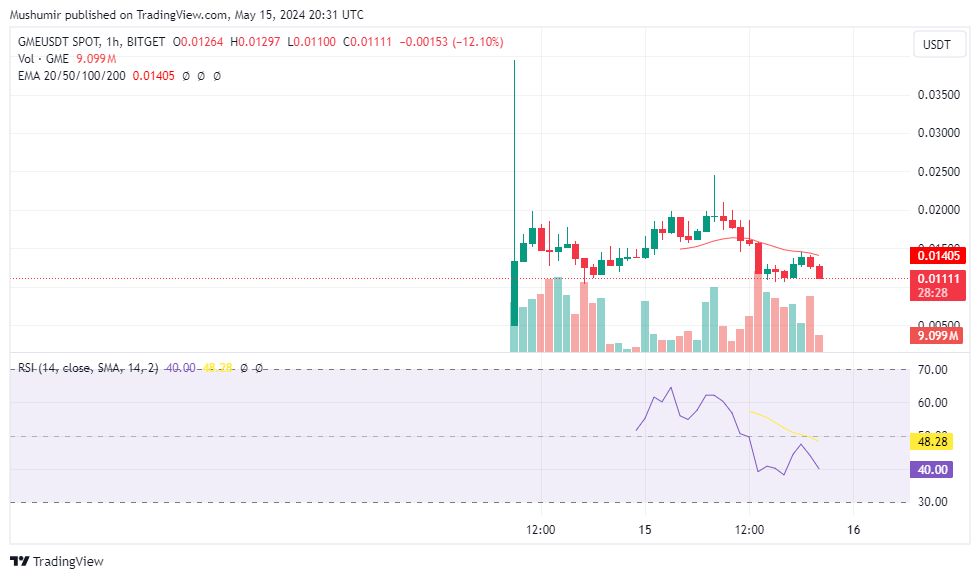
GameStop (GME) crypto has experienced a substantial decline in price over the last 24 hours, with its value plummeting by 26.97% to reach $0.01103. This significant downward movement is accompanied by a marginal increase in trading volume, which has risen by 0.54% to $190,166,618, indicating some level of sustained activity in the market amidst the price drop.
Examining the technical indicators, the Relative Strength Index (RSI) for GameStop is currently at 40.41. An RSI value below 50 typically suggests a bearish sentiment, indicating that the selling pressure may outweigh the buying pressure in the market. However, the RSI is not in oversold territory, suggesting that there may still be room for further price declines before reaching a potential reversal point.
In the end, GameStop’s price analysis presents a bearish outlook in the short term, as indicated by the substantial price decline and the RSI below 50. Traders should exercise caution and closely monitor price movements and key indicators for potential opportunities or signs of a trend reversal.