SHIB’s Bearish Cues Indicate Shiba Inu Price Could Tumble Nearly 50%

NOIDA (CoinChapter.com)— Shiba Inu traders might face a potential price drop thanks to the SHIB price forming a bearish technical pattern. Though SHIB fans continue promoting the token, market sentiment seems to be bearish for the canine-themed token.
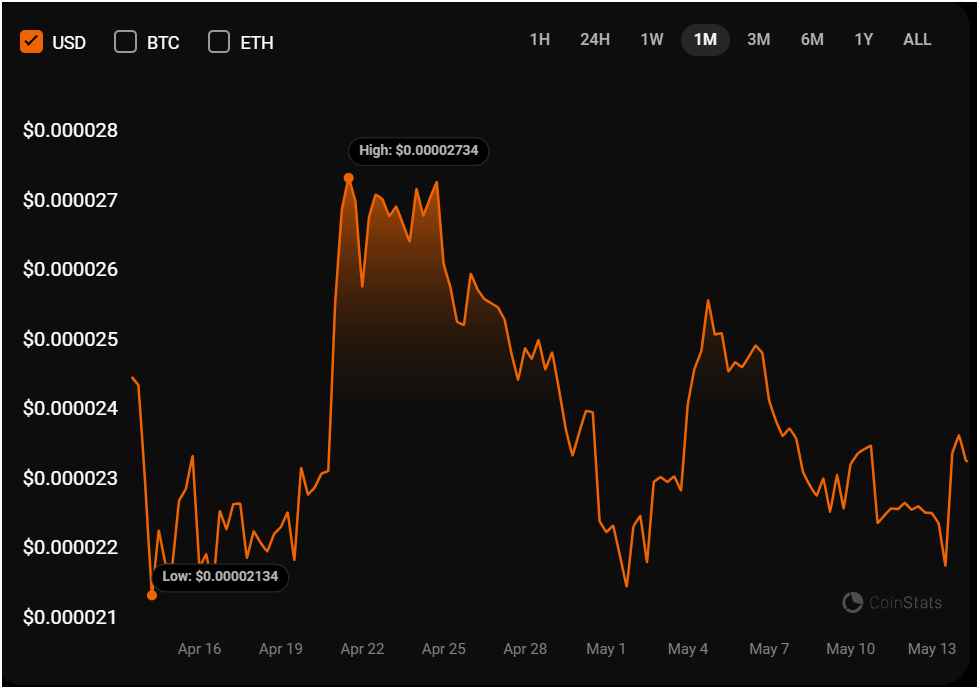
SHIB price has nearly pared all its gains in the past 30 days, highlighting the bearish pressure against Shiba Inu. Moreover, SHIB whales have been moving their holdings to exchanges, further fueling bearish speculations against the memecoin.
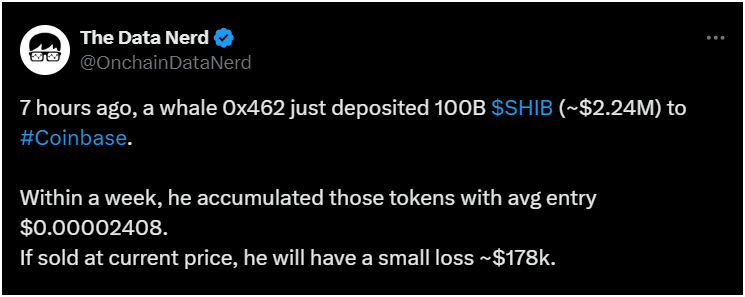
On-chain data tracker ‘The Data Nerd‘ shared in an X post that a whale address 0x4624 moved 100 billion SHIB tokens, worth $2.24 billion at the time, to the Coinbase exchange.
Traders usually consider whale addresses moving their tokens to exchanges a bearish signal, since it means large holders are getting ready to dump their tokens, creating a supply surge and reducing price.
SHIB Price’s Bearish Triangle Issues
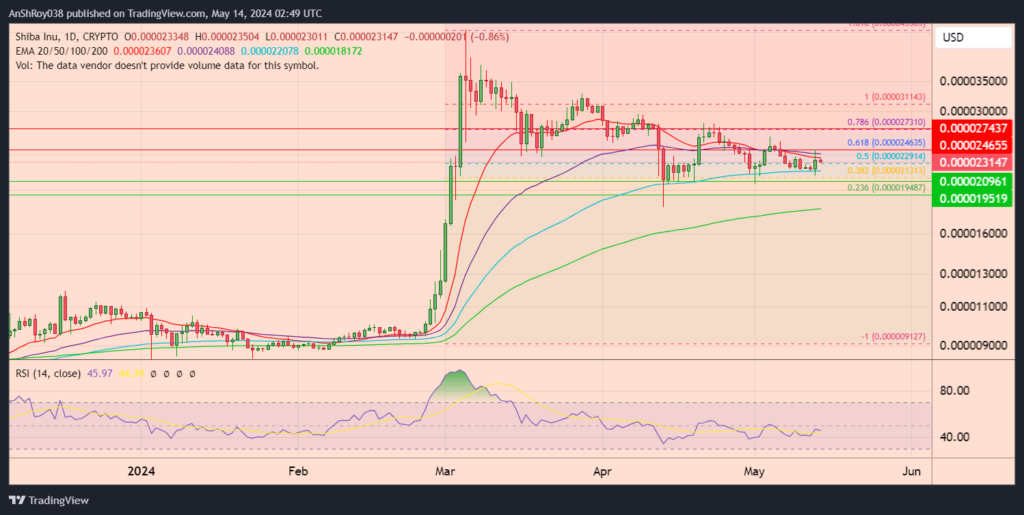
Meanwhile, SHIB price has formed a bearish technical setup called the ‘descending triangle.‘

Market analysts predominantly consider the descending triangle a bearish continuation signal.
The configuration features a downward-sloping upper trendline, which gradually reduces the price action’s highs, and a flat lower trendline, which is a consistent support level the price finds difficult to break.
Moreover, the pattern suggests that selling pressure is intensifying and consistently overpowering the buyers, leading to successively weaker rallies. In this setup, the potential price target is typically gauged by the maximum height of the triangle at its widest point.
Hence, confirming the bearish pattern might result in the Shiba Inu token dropping nearly 48.5% to reach the projected price target near $0.000012.
SHIB Price Fails To Conquer Resistance Confluence
Meanwhile, the SHIB price continued to trade below the 20-day EMA (red wave) and 50-day EMA (purple wave) resistance confluence. The Shiba Inu token has been unable to move above the resistance confluence since April 25 earlier this year, highlighting the bearish pressure against it.
Moreover, the long upper wicks on recent daily price candles further underscore the bearish sentiment against the Shiba Inu token. Climbing above the resistance confluence would help SHIB price reach the resistance near $0.000025.

Moreover, breaking and consolidating above the immediate resistance might help the Shiba Inu token overcome bearish sentiments to target the resistance near $0.0000274.
On the other hand, if the token buckles under bearish pressure, the Shiba Inu token might drop to the support level near $0.000021. Failure of the immediate support level might force SHIB price to test the support near $0.000019 before recovering.
The relative strength index for SHIB remained neutral, with a score of 45.97 on the daily charts.
The post SHIB’s Bearish Cues Indicate Shiba Inu Price Could Tumble Nearly 50% appeared first on CoinChapter.