SOL Price Reversal Hints End Of Correction Rally To Hit $200
The post SOL Price Reversal Hints End Of Correction Rally To Hit $200 appeared first on Coinpedia Fintech News
With a minor correction last week, Solana’s price trend remains under stress amidst the broader market slowdown. However, as Bitcoin makes a recovery to start this week with a 2.26% jump, the sideline traders anticipate a boom in altcoins this week.
Will the broader market comeback result in a boost in the Solana price trend? Will Solana sustain the reversal momentum to hit the $500 mark in 2024? Find out more in our SOL price prediction.
Solana Price Performance
With a long-coming support trendline in the SOL price trend, the underlying demand is evidently strong. Further, the recent comeback from the support trendline challenges the dynamic 50D EMA and the $150 psychological mark.
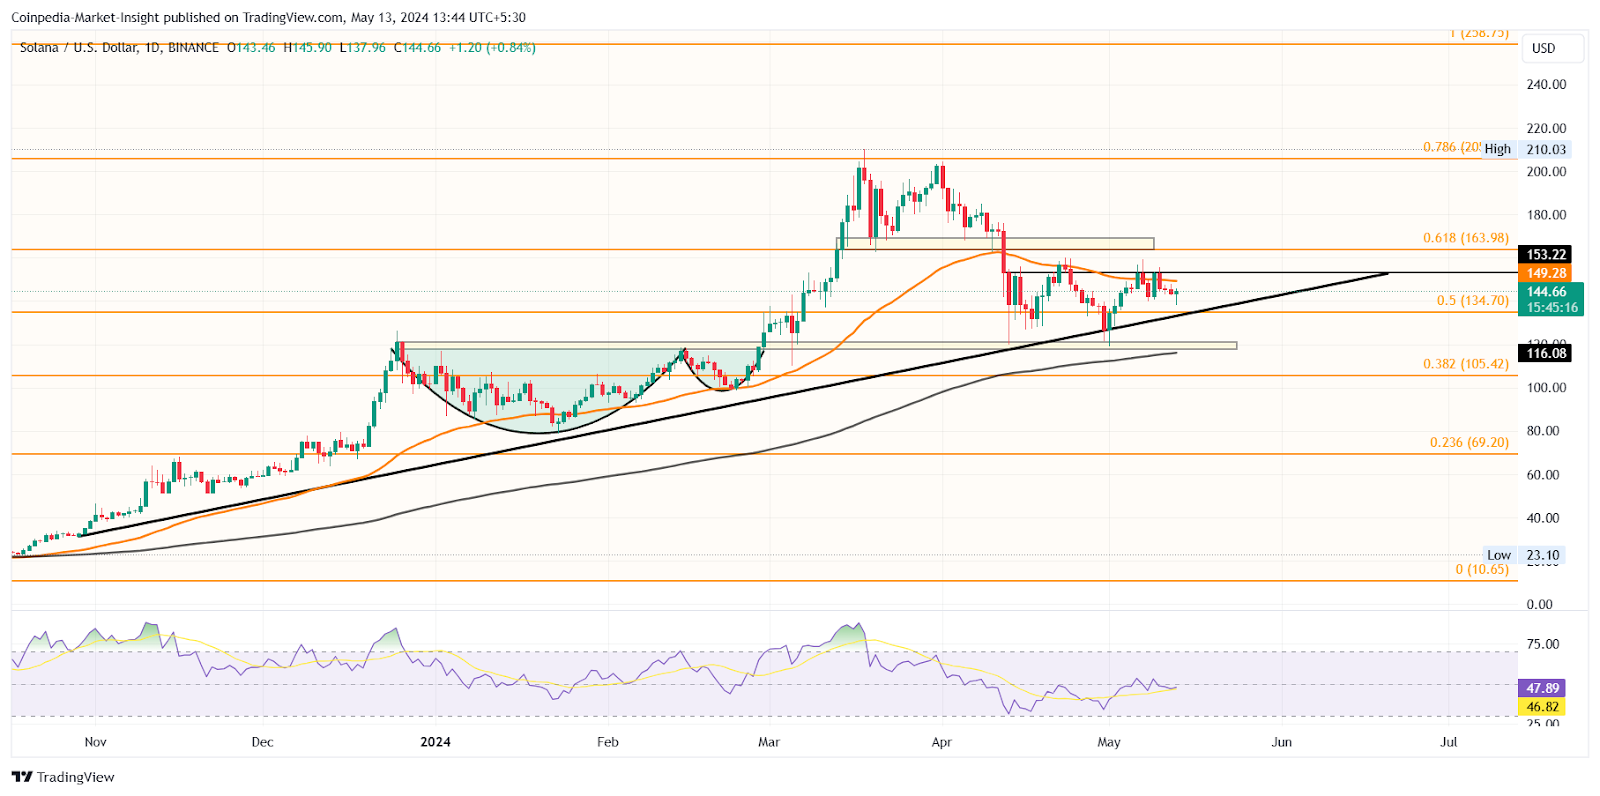
As the SOL price sustains above the 50% Fibonacci level, the short-term price trend teases a potential inverted head and shoulder pattern. The neckline of the pattern stands at the psychological mark of $150.
Hence, a breakout above this crucial resistance will boost the uptrend momentum in Solana. Currently, the Solana price trades at $145 with an intraday move of 1.25%, creating a long-tail bullish candle. With increased volumes, the intraday candle projects a high likelihood of an uptrend.
Technical Indicators:
MACD Indicator: The MACD and signal lines are converging for a bearish crossover. However, a bullish comeback will prolong the positive trend.
RSI: The daily RSI line shows a rising trend, struggling to sustain above the halfway line.
Will SOL Price Cross $200?
As the broader market recovery possibility is on the rise, with Bitcoin bouncing back above $62,000, the SOL price could surge higher. With a potential bullish trend, Solana is ready for a jump above $150. If the SOL price crosses the psychological mark of $150, a pump to the $200 is possible.
Conversely, a drop under the support trendline will nullify the bullish pattern. In such a case, the bearish trend will reach the $120 mark.