Bitcoin, Ethereum, And XRP Price Prediction: Is The Correction Phase Over?

The post Bitcoin, Ethereum, And XRP Price Prediction: Is The Correction Phase Over? appeared first on Coinpedia Fintech News
The crypto market has displayed significant price fluctuations over the past week following increased volatility in the crypto industry. Moreover, top crypto tokens continue their struggle to hold their respective value above their crucial support levels.
Furthermore, Bitcoin price has recorded a correction of 3.61% within the past seven days. Following in its footsteps the ETH price plunged 6.61%, whereas the XRP price lost 4.96% during the same time, highlighting a strong bearish sentiment in the industry.
Will the crypto industry record a bullish rebound during the upcoming week amid increased price volatility?
Bitcoin Price Displays A Bearish Price Action:
Despite increased price volatility in the crypto industry, the market leader, BTC price, has lost 3.47% within the past day and has recorded a drop of 1.93% in its 24-hour trading volume. Further, it has recorded a correction of 14.18% over the past 30 days.
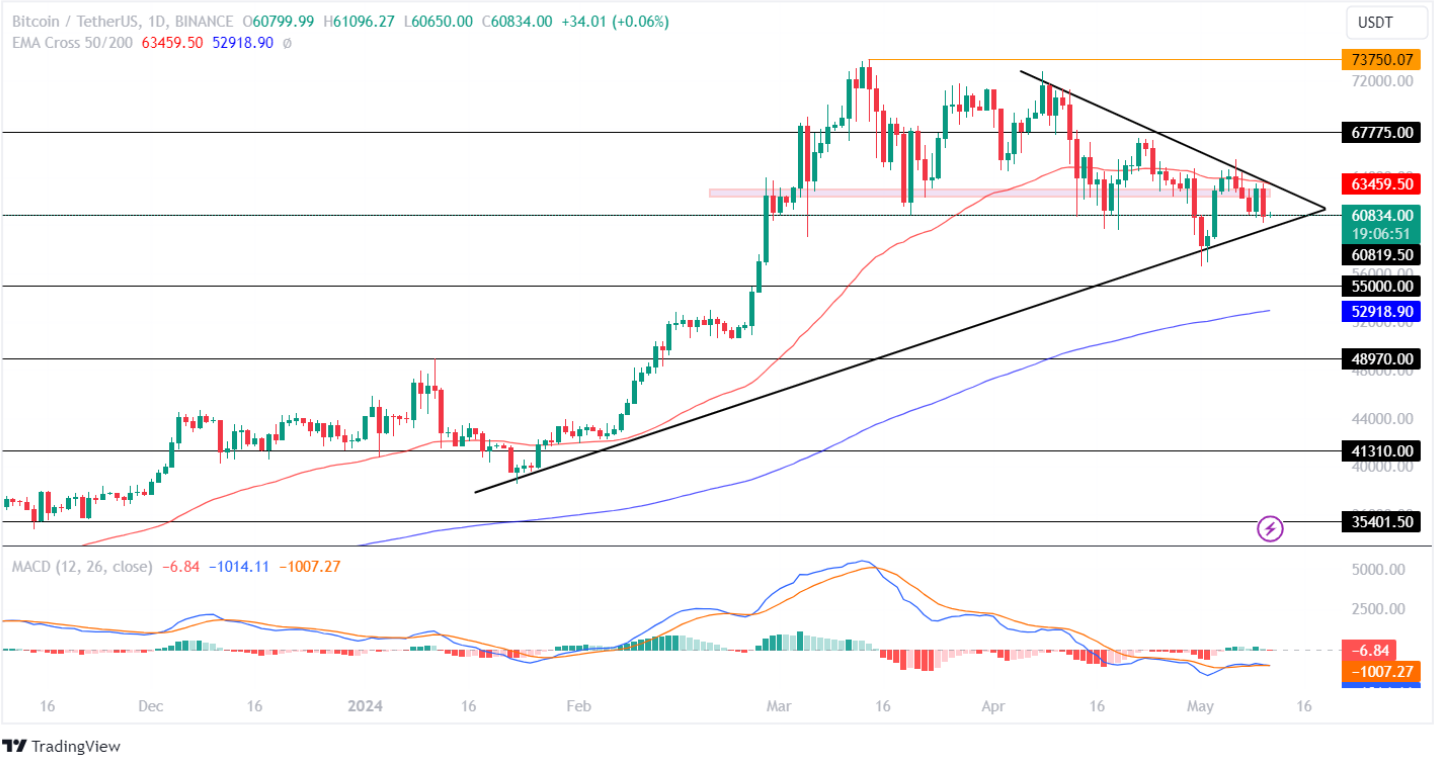
Moreover, it has formed a symmetric triangle and continues to trade within it, indicating uncertainty in future price action. Furthermore, the EMA 50-day acts as a resistance to the price chart, highlighting a strong bearish sentiment in the cryptocurrency industry.
On the other hand, the technical indicator, MACD, shows a constant flatline in its 1D time frame, highlighting a weak price action for the market leader in the crypto space. However, the averages display a bearish convergence, suggesting a mixed sentiment in the crypto industry.
If the bulls regain momentum, the Bitcoin price will retest its resistance trendline of the symmetric triangle during the upcoming week. Conversely, bearish price action could result in the BTC token plunging toward its crucial support level of $60,000.
Ethereum Fails To Breakout Of Its Falling Channel Pattern:
The altcoin leader, Ethereum price, has continued trading in a falling channel pattern since mid-March, indicating a rising disinterest of investors in it. Moreover, the delayed approval of the Spot EthereumETF by the Securities and Exchange Commission (SEC) has been one of the prime reasons for this bearish price action.
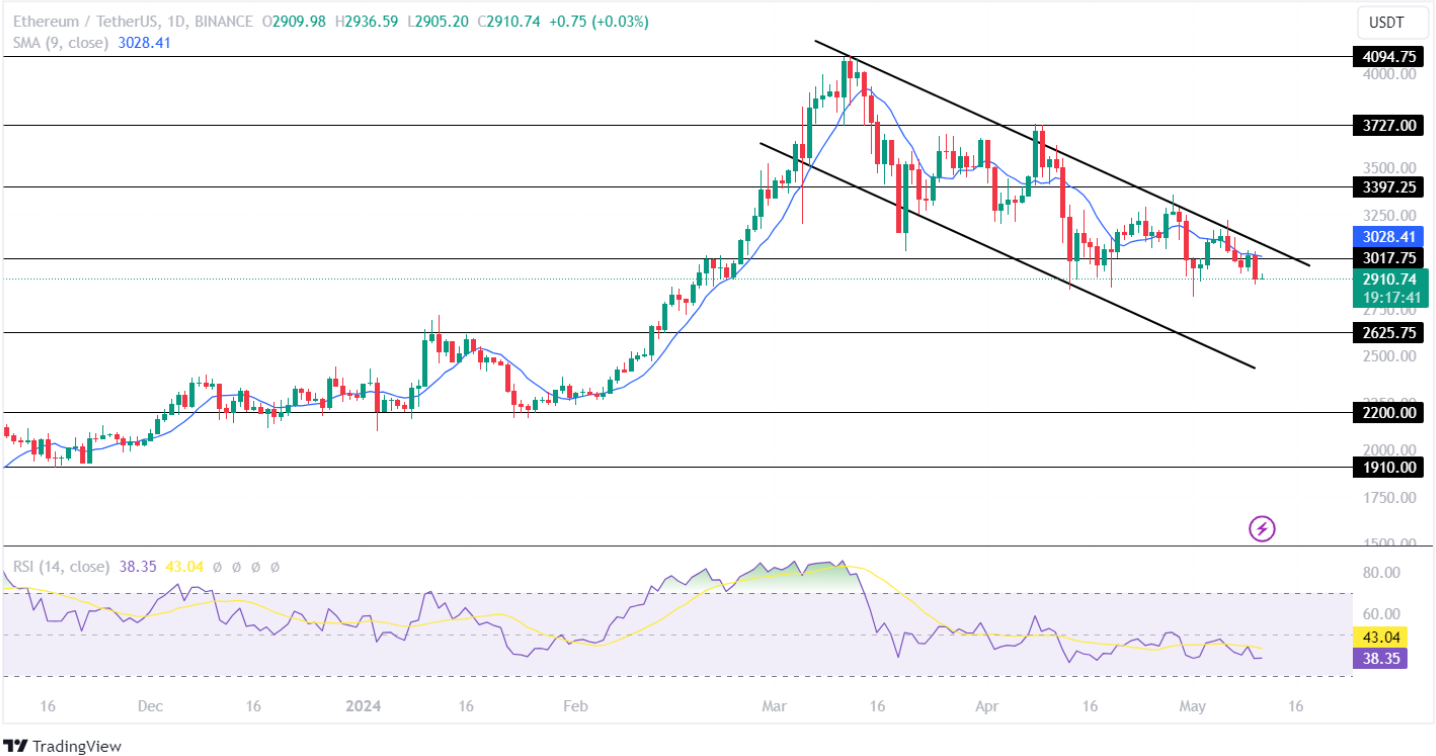
The Simple Moving Average (SMA) has been constantly acting as a resistance to the ETH price chart, indicating a weak bullish influence in the crypto industry.
Moreover, the Relative Strength Index (RSI) has been constantly trading below the mid-point, indicating a rising disinterest of investors in this altcoin. Furthermore, the averages display a bearish curve, hinting at a negative price action in the coming time.
If the market pushes the price above the important resistance level of $3,017, the bulls will regain momentum and attempt to break out of its falling channel pattern. However, if the bears continue to dominate the market, it will plunge toward its low of $2,650 this month.
Ripple Token On The Verge Of A Breakdown:
The XRP price is repeatedly failing to regain momentum, resulting in the Ripple token recording a correction of 2.35% within the past day and approximately 5% over the past week. Moreover, XRP tokens Year-to-Date (YTD) return stands at -17.95%, highlighting a long-term bearish sentiment.
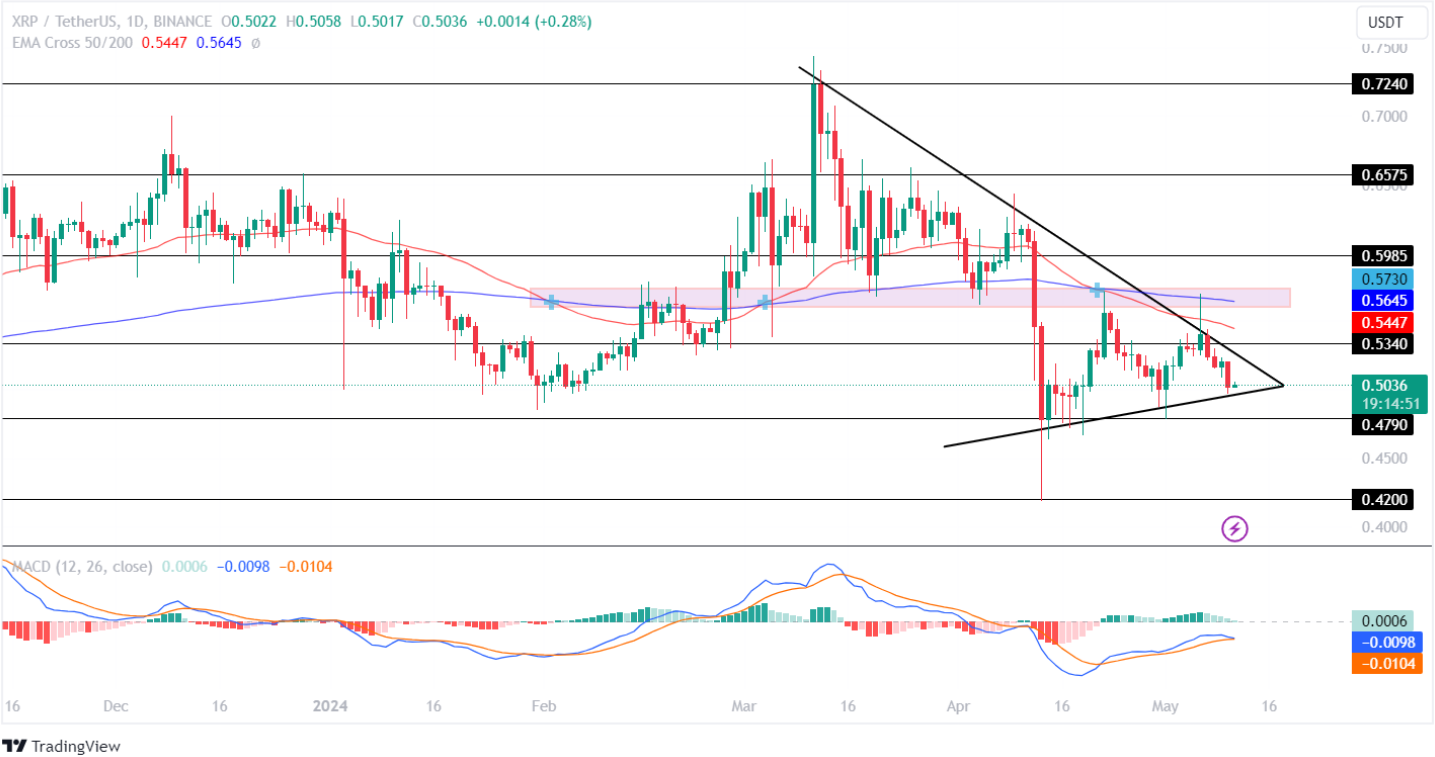
The Moving Average Convergence Divergence (MACD) shows a constant decline in the histogram, highlighting increased selling pressure within the crypto space. On the other hand, the averages show a bearish convergence in the 1D time frame, suggesting a negative outlook for the altcoin.
If the market experiences a bullish reversal, the Ripple price will attempt to retest its resistance level of $0.5340 during the upcoming week. On the contrary, if the bears continue to hold power, the Ripple token may fall toward its support level of $0.4790 by breaking down its triangle pattern.
Conclusion:
With the crypto industry concluding this week on a bearish note, the chances of a bullish recovery during the upcoming week have increased. Conversely, the market may record a delayed bullish price action if the BTC, ETH, and XRP prices fail to hold their values above their crucial support levels.