Daily Market Review: BTC, ETH, XRP, SOL, ADA
Today’s market session has seen bulls on the front foot as seen from the increase in the global market cap. The total cap stood at $2.33T as of press time, representing a 1.99% increase over the last 24 hours while the trading volume stood at $63.67B as of press time 0.81% decrease over the last 24 hours.
Bitcoin Price Review
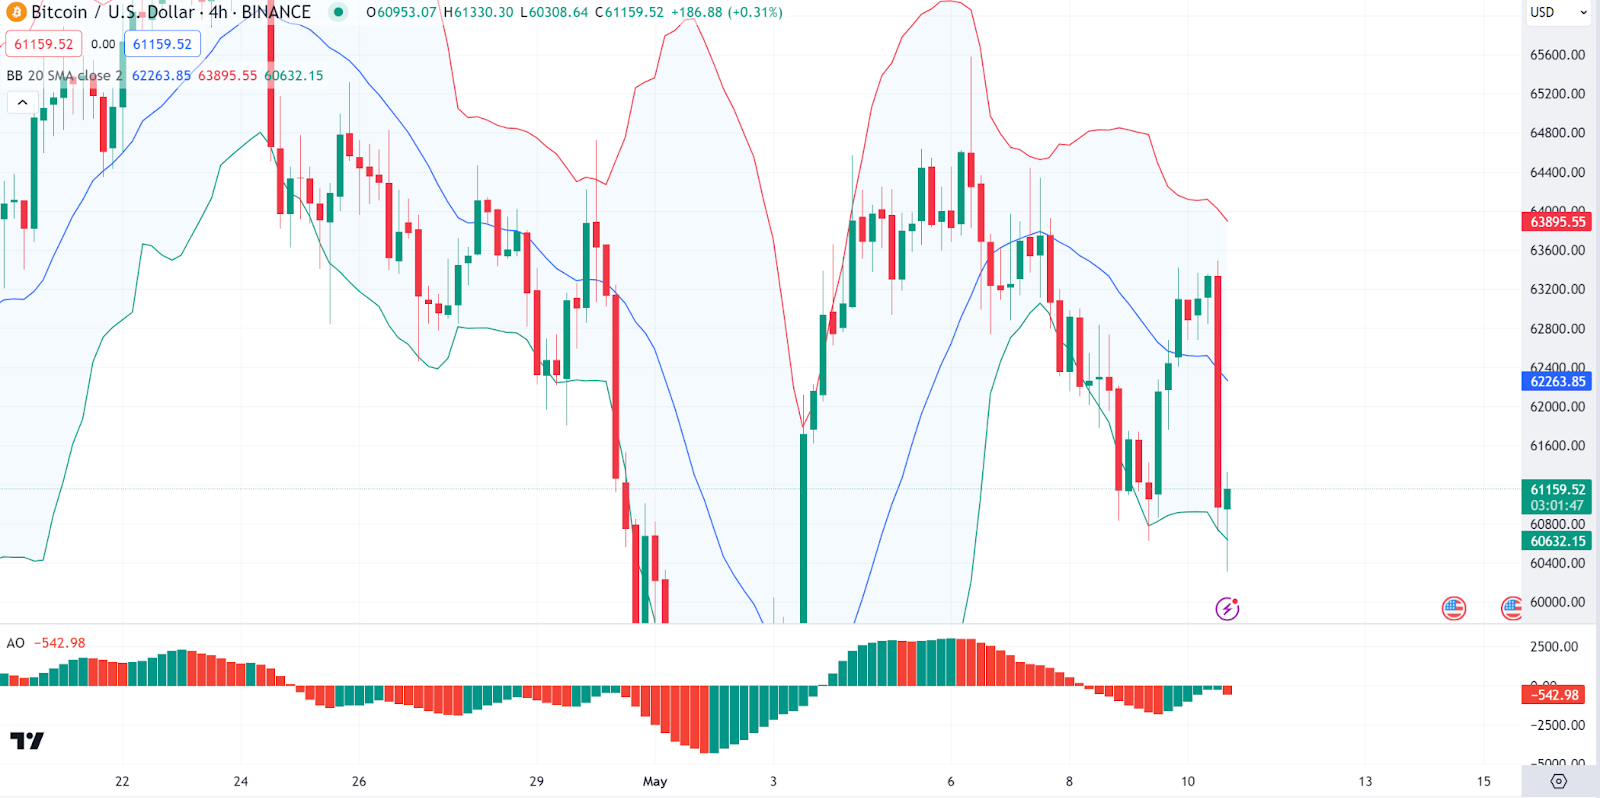
Bitcoin (BTC) is on bearish activity today despite the bullish sentiment, as seen from its price movements. Looking at an in-depth analysis, we see the Bitcoin chart indicates a recent price recovery after a substantial fall below the lower Bollinger Band. This suggests a potential oversold condition that could have triggered buying interest. The candles have moved back inside the bands with a slight upward movement, indicating stabilization.
The Awesome Oscillator shows increasing green bars, hinting at growing bullish momentum. However, the price remains below the middle Bollinger Band, indicating that the overall short-term trend is still bearish. As of press time, the Bitcoin price stood at $60,678, representing a 2.15% decrease from its previous 24-hour price.
Ethereum Price review
Ethereum (ETH) is also back tracking as seen from its price movements today. Looking at an in-deptha analysis, we see that Ethereum’s price action is contained within the Ichimoku Cloud, indicating a lack of clear trend in the short term. The recent price movement below the cloud suggests a potential shift towards bearish territory.
On the other hand, the Woodies CCI is showing a consistent oscillation around the zero line, suggesting uncertainty and potential consolidation. Traders might watch for a decisive break out of the cloud for clearer directional cues. As of press time, the Ethereum price stood at $2,905, representing a 2.99% decrease from its previous 24-hour price.

Ripple Price Review
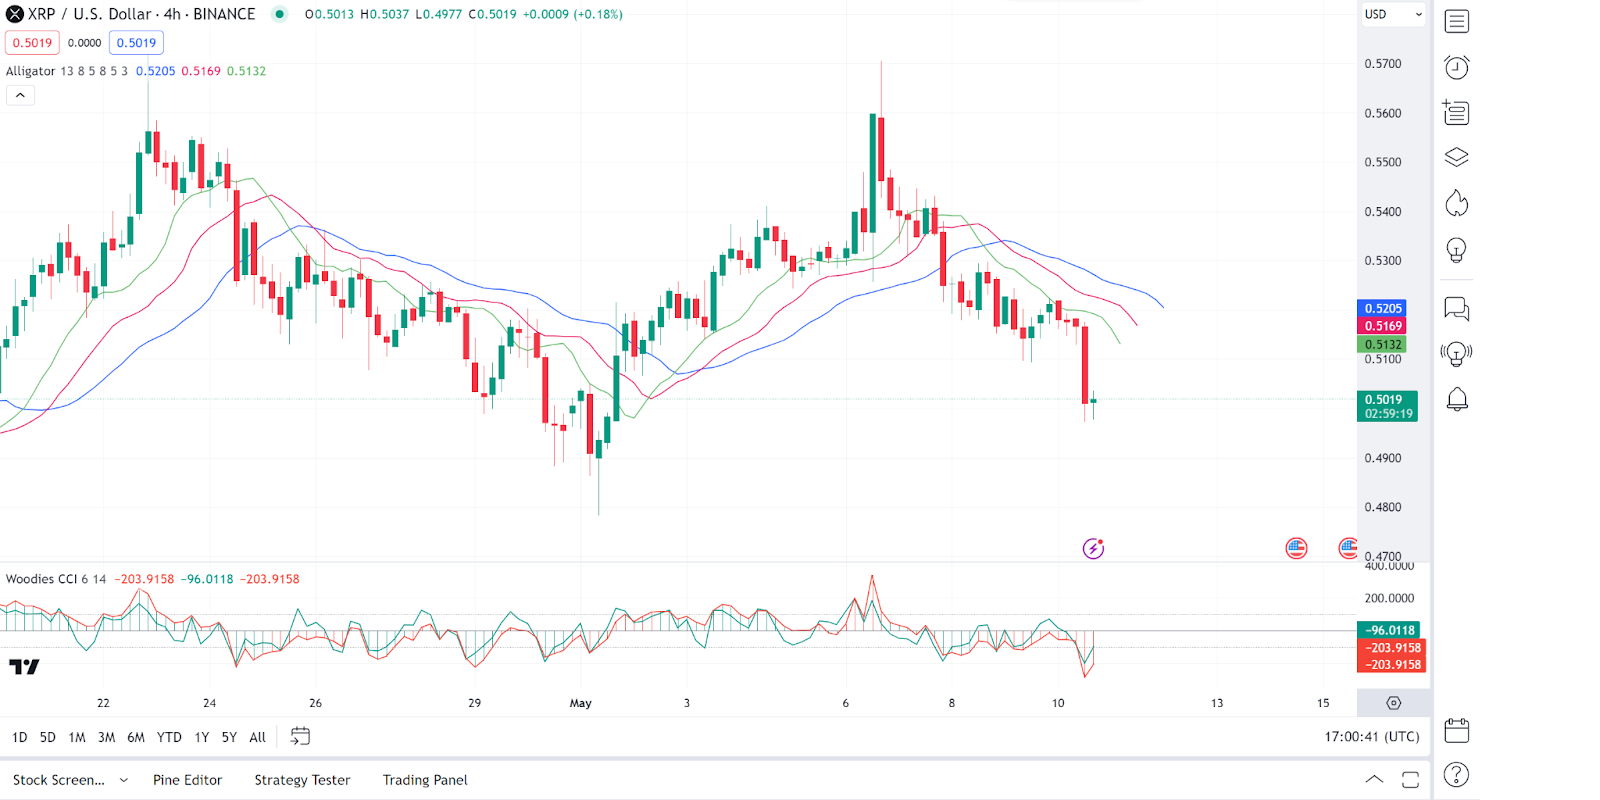
Ripple (XRP) is also having a bearish session as evidenced by its price movements in today’s session. Looking at an in-depth analysis, we see that XRP’s price is demonstrating a downtrend as it continues to make lower highs and lower lows. The recent price action below all three moving lines of the Alligator indicator confirms the bearish bias.
On the flip seide, the Woodies CCI is deep in the negative territory, reinforcing the strong bearish sentiment. The immediate trend is bearish, and a break below recent lows could intensify selling pressure. As of press time, the Ripple price stood at $0.5014, representing a 2.71% decrease from its previous 24-hour price.
Solana Price Review
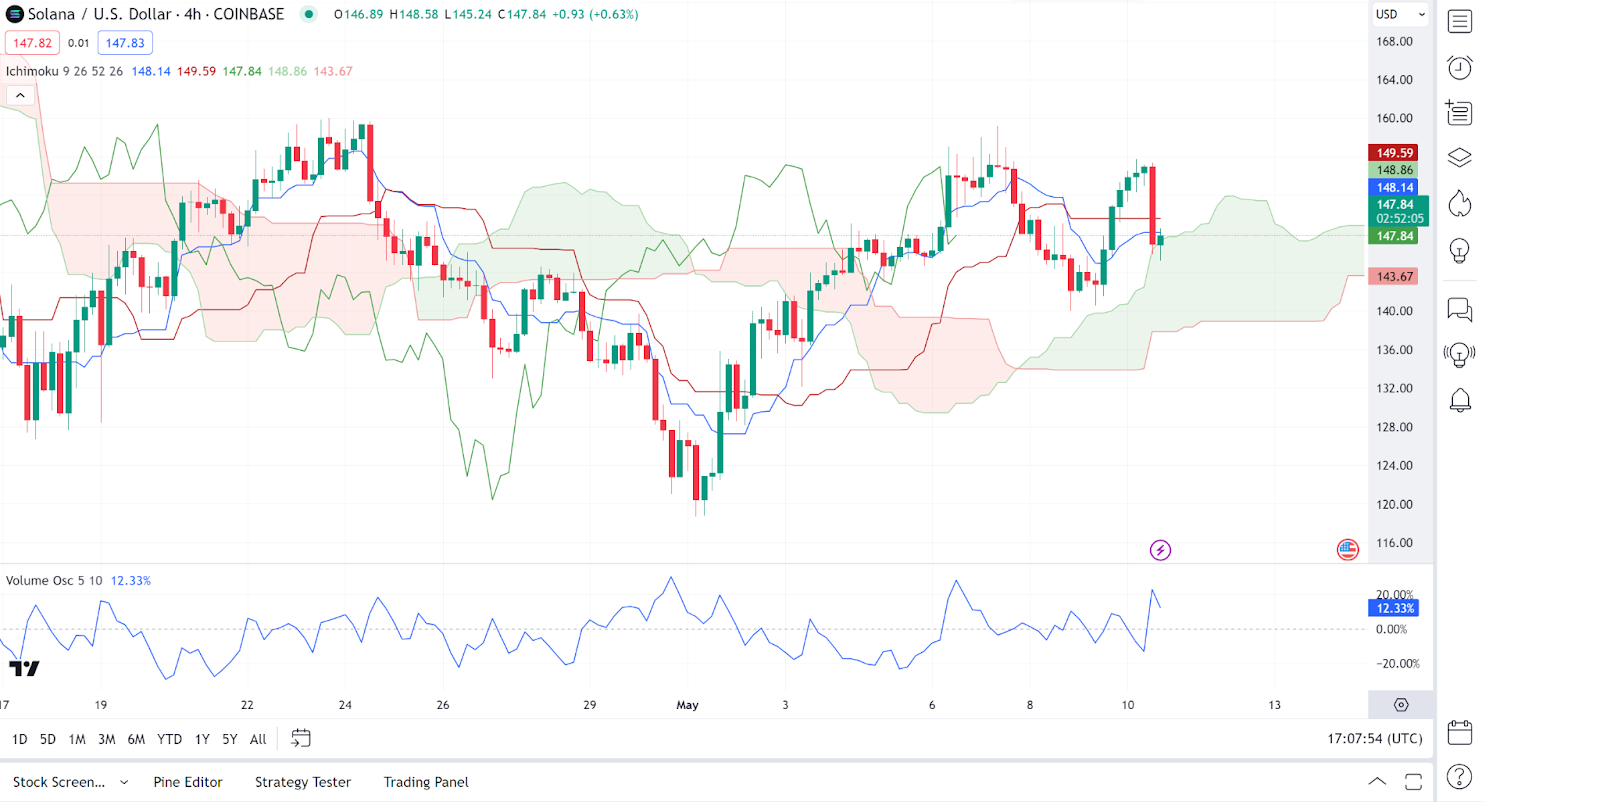
Solana (SOL) is among today’s gainers as seen from its price movements. Analysing Solana price charts, we see that Solana shows fluctuating momentum within the Ichimoku Cloud. The recent rebound off the cloud’s lower boundary suggests some buying support; however, the overall market sentiment remains uncertain as price oscillates within the cloud.
On the other hand, the Volume Oscillator shows no significant volume increase to confirm a strong trend, which could imply continued consolidation. Observing for a breakout above the cloud could signal a bullish reversal, whereas a drop below the cloud would confirm bearish continuation. As of press time, the Ripple price stood at $146.7, representing a 0.05% decrease from its previous 24-hour price.
Cardano Price Review
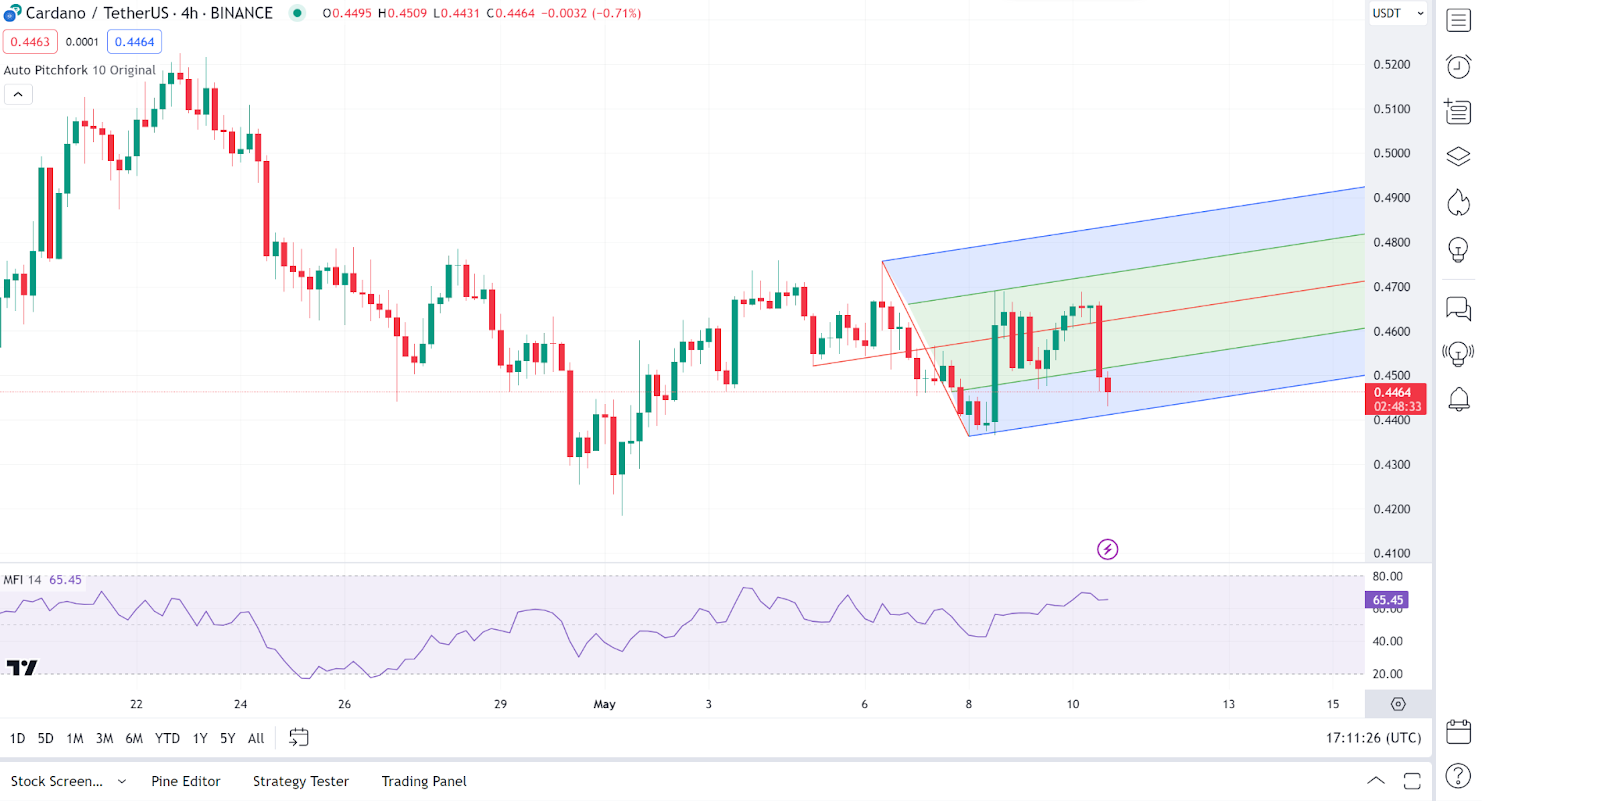
Cardano (ADA) has also fallen short of gains as it also drops valuation in today’s session. Looking at an in-depth analysis, we see that Cardano is currently trading within a descending channel pattern, indicating a continued bearish outlook. The Cardano price has recently touched the upper boundary of the channel and rejected it, suggesting that the bearish trend is still dominant.
On the other hand, the Money Flow Index (MFI) is at a mid-level, not indicating oversold or overbought conditions, which supports potential continuation of the current trend. Traders might look for selling opportunities at the upper channel line or wait for a breakout above the channel to change the bearish perspective. As of press time, the Cardano price stood at $0.4445, representing a 2.5% decrease from its previous 24-hour price.