Solana (SOL) Price Bounces Back: Signaling a Bullish Breakout?
Following a recent bearish rejection at resistance, the Solana (SOL) price underwent a correction. However, in the past day, SOL price surged by over 9%.
Whether the SOL price will successfully surpass the resistance or face another bearish rejection, leading to further correction, remains uncertain.
Solana Rallies 9%: Momentum Builds for Even Higher Prices
Four days ago, the SOL price faced bearish rejection at the resistance zone, spanning approximately from $157 to $160, continuing its downward trajectory. However, SOL experienced a notable surge yesterday, recording a gain of over 9%.
Currently, SOL appears to be sustaining its upward momentum, encountering significant resistance once more within the $157 to $160 range. A breakthrough past this resistance could propel SOL towards the critical Fibonacci resistance at approximately $175, marking a potential end to the correction phase.
The prevailing indicators lean towards bullish sentiment. Notably, the EMAs exhibit a golden crossover, signaling a bullish trend in the short to medium term.
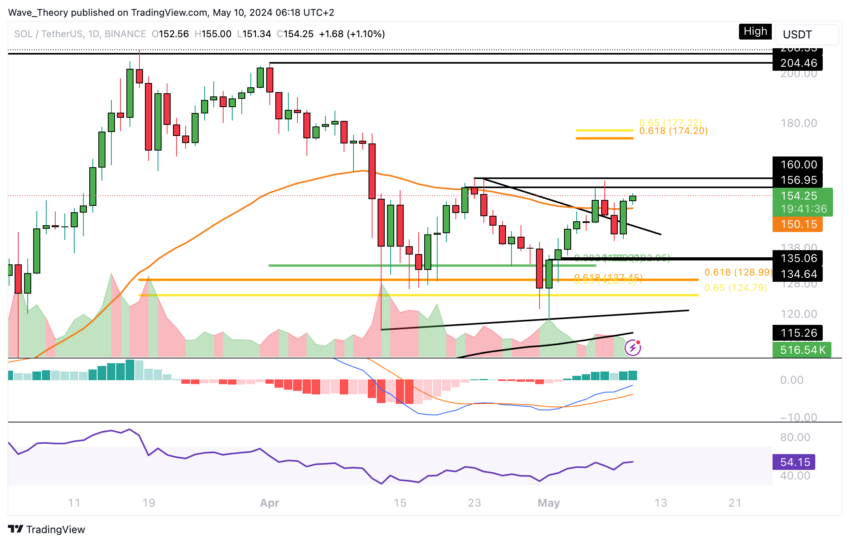 Solana (SOL) Price Analysis. Source: Tradingview
 Additionally, the MACD lines are bullish, accompanied by an upward tick in the MACD histogram since yesterday. However, the Relative Strength Index (RSI) remains neutral at present.
Solana’s 4H Chart Shows Predominant Bullish Trend
In the 4-hour chart, the indicators echo a predominantly bullish outlook. The MACD lines exhibit a bullish crossover, accompanied by an upward trend in the MACD histogram, while the RSI remains indecisive, offering no distinct signals.
Read More: How to Buy Solana (SOL) and Everything You Need To Know
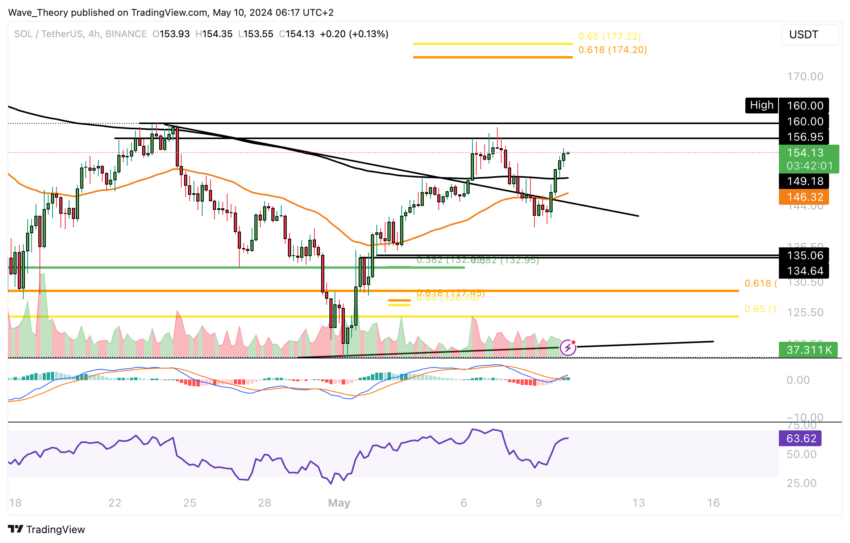 Solana (SOL) Price Analysis. Source: Tradingview
 Moreover, there is a possibility of the EMAs forming a golden crossover soon, further bolstering the bullish sentiment in the short term. However, it’s worth noting that the Death Cross remains intact at present, signaling a bearish trend in the short term.
What If Solana Faces Bearish Rejection at Resistance Again?
If Solana faces another bearish rejection at the resistance zone spanning approximately $157 to $160, it may resume its decline toward Fibonacci support levels between roughly $125 and $133.
Failure to breach this resistance could lead Solana to test critical Fibonacci support around $85. The 50-week EMA, positioned near $94, also serves as a notable support level.
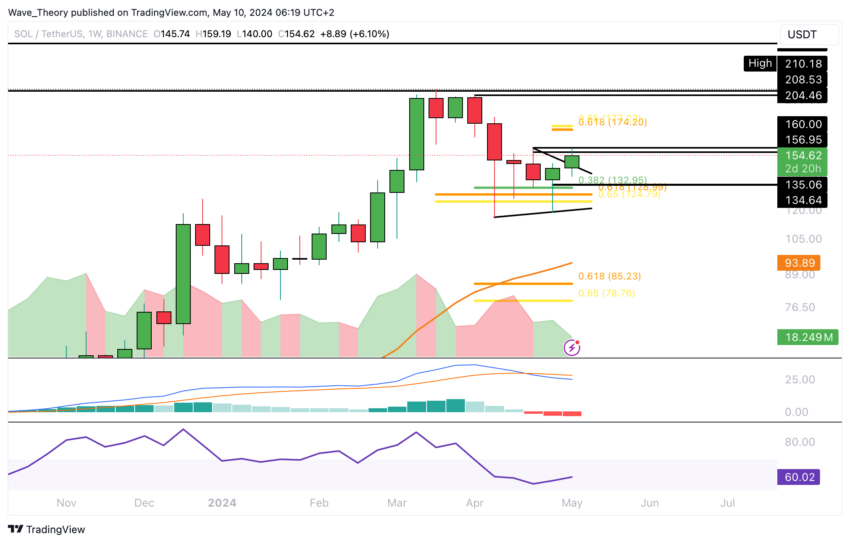 Solana (SOL) Price Analysis. Source: Tradingview
 In the weekly chart, the MACD lines remain bearish, accompanied by a downward trend in the MACD histogram, while the RSI hovers in neutral territory.
Solana’s Monthly Chart Analysis: MACD Histogram Shows Bearish Trend
In the monthly chart, the MACD histogram has been exhibiting a bearish trend since last month, indicating a continued correction phase for SOL. Despite a slight recovery in the SOL price this month, the MACD histogram has yet to display bullish momentum.
However, the bullish crossover of the MACD lines and the neutral position of the RSI suggest a potential shift in momentum. Whether Solana will sustain its correction and approach the $85 mark in the medium term largely hinges on its ability to surpass the golden ratio resistance of around $175.
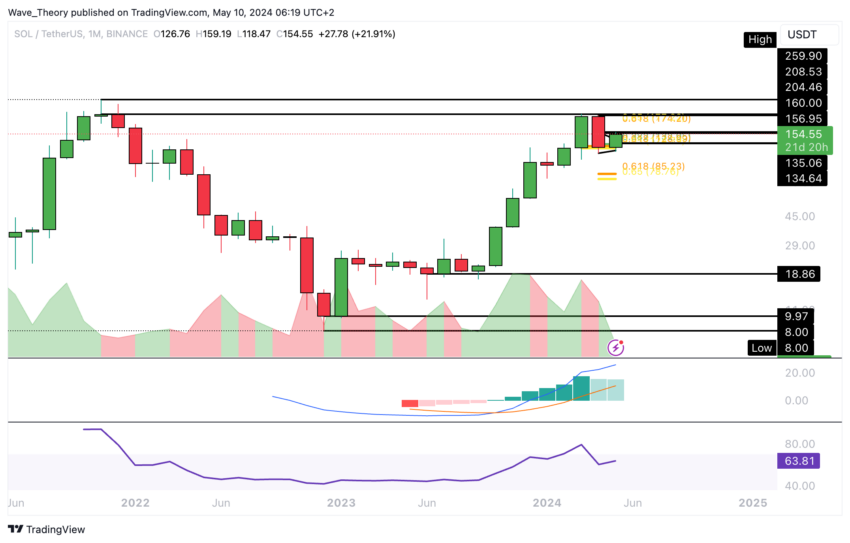 Solana (SOL) Price Analysis. Source: Tradingview
 Maintaining a price level above $85 would uphold the bullish trajectory in the medium term. Conversely, a failure to do so could signal a return to a downward trend, potentially leading to lower price regions such as $19.
SOL Gains Momentum Against BTC
Against BTC, Solana recently experienced a bullish bounce from the 0.382 Fib support at approximately 0.0021 BTC, signaling a potential reversal. This week, Solana seems to surpass the 0.382 Fib resistance around 0.00237 BTC, paving the way for a possible move toward the Golden Ratio resistance at 0.00268 BTC.
A successful break above this level could mark the end of the corrective phase for now, potentially allowing Solana to target the golden ratio resistance at approximately 0.003 BTC.
Read More: Solana (SOL) Price Prediction 2024/2025/2030
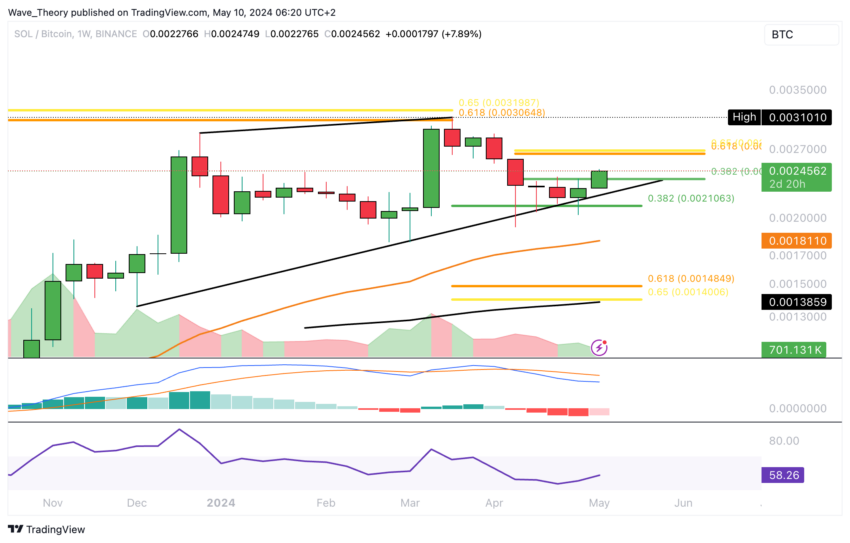 Solana (SOL/BTC) Price Analysis. Source: Tradingview
 While the MACD histogram shows signs of bullish momentum this week, the MACD lines remain bearishly crossed, and the RSI maintains a neutral stance.