When Will Bitcoin Reach $70,000? Bitcoin Price Technical Analysis

The cryptocurrency market has been experiencing significant volatility, particularly observed in Bitcoin’s price fluctuations. Since the start of the month, Bitcoin has demonstrated a high degree of variability, initially recording a low of $56,552 and subsequently surging past $65,000 swiftly. This sharp price fluctuation has captivated numerous large-scale investors, commonly known as whales, who have started to significantly increase their holdings, leading to new peaks in recent weeks.
An analysis of Bitcoin’s current trajectory, utilizing mainly the Exponential Moving Average (EMA) and the Relative Strength Index (RSI) on the BTCUSDT chart, sheds light on the potential future movements of this cryptocurrency. This detailed examination provides insights into the trends and patterns that might influence Bitcoin’s performance in the near term, including reaching the mark of $70,000.
Potential for Significant Bitcoin Movement as RSI Hovers Around Neutral
Bitcoin’s price finds a dynamic level of support and resistance in its 9-day EMA, currently trading slightly above it at approximately $62,463. This positioning suggests tentative support and hints at continued bullish momentum, historically associated with prices holding above their short-term EMAs. However, the closeness of Bitcoin’s price to the EMA also hints at potential volatility, with the EMA acting as a pivot point for future price movements, either upwards or downwards.
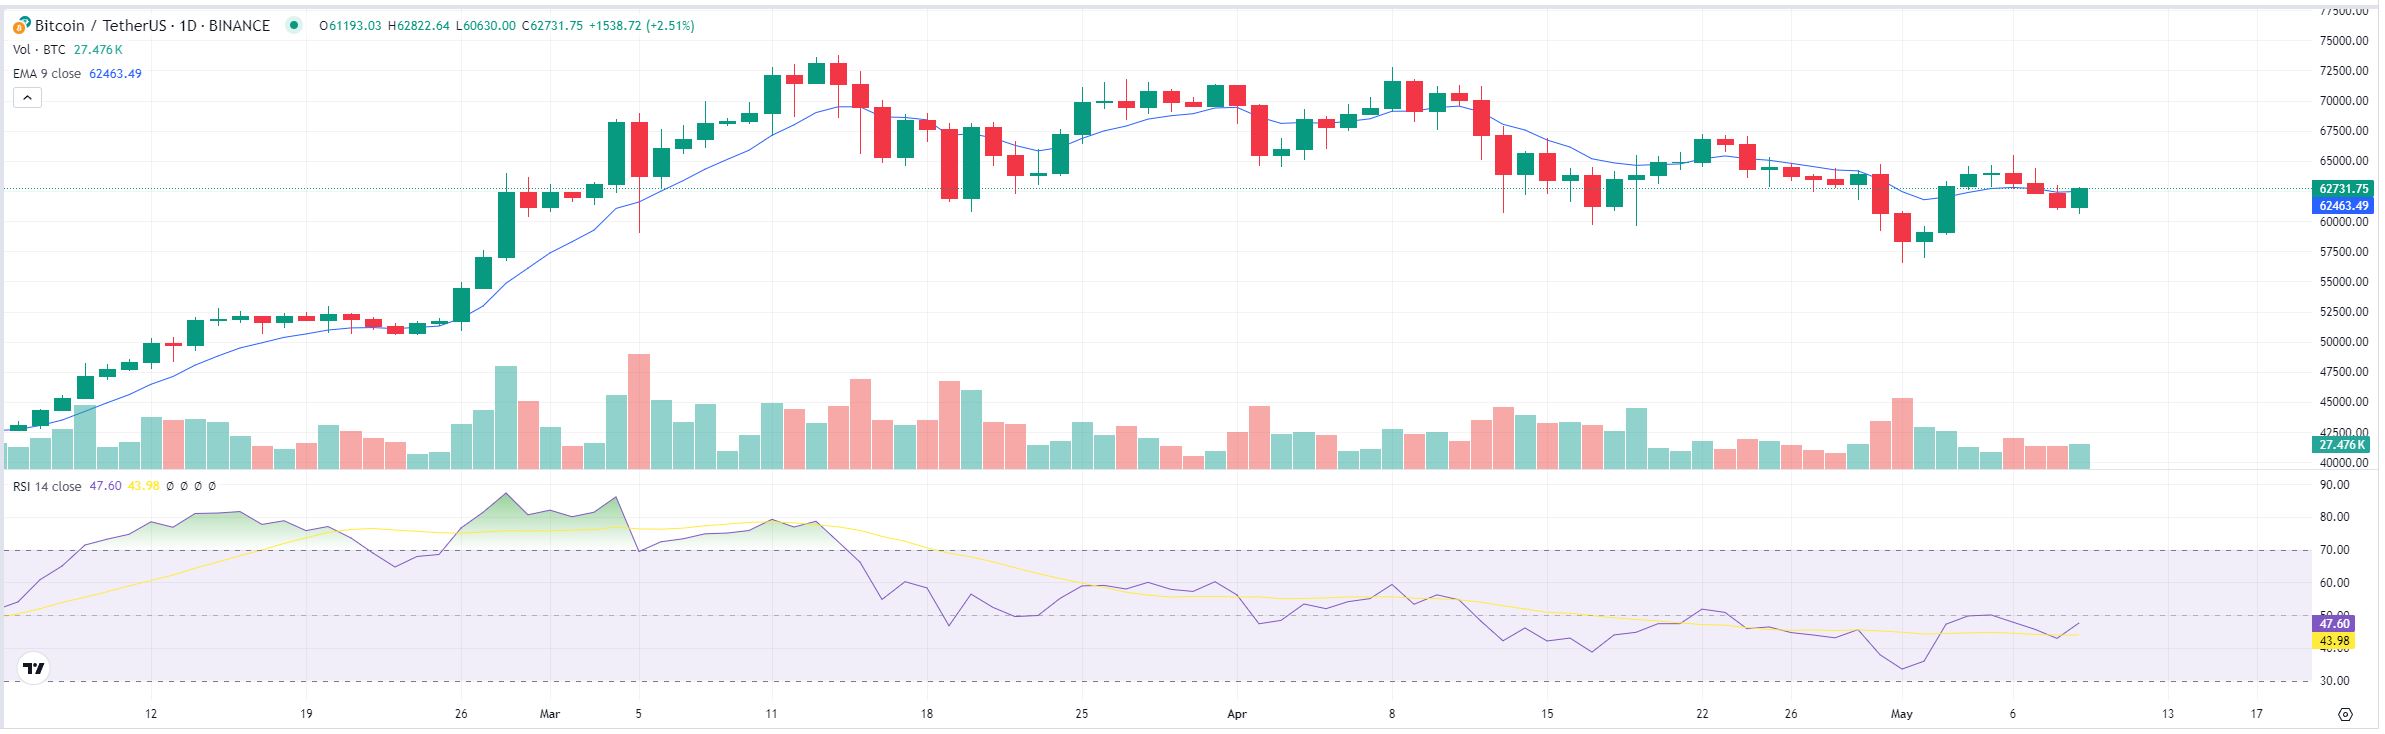
Source: TradingView
The Relative Strength Index (RSI) of Bitcoin is currently around 47.60, placing it firmly in neutral territory. This level indicates that Bitcoin is neither overbought nor oversold, suggesting a balance between buying and selling pressures. However, this neutrality also highlights the market’s current indecision, potentially setting the stage for a significant price movement once a clearer trend emerges.
An examination of the volume bars in relation to price movements shows a decrease in trading activity in recent days. This low volume, when observed alongside stable or increasing prices, may suggest that buyers lack strong conviction, potentially signaling that the current support level is not as solid as it might seem. For a convincing confirmation of a robust upward trend towards the $70,000 target, a substantial rise in volume, especially with bullish candlesticks, would be essential.
Technical And Macroeconomic Factors Seem To Set the Stage for a Price Surge
Bitcoin’s position above the 9-day EMA, coupled with an RSI trending towards overbought territory, indicates increasing buying pressure. If this trend continues alongside positive macroeconomic news or further adoption by institutions, such as increased investment or favorable regulatory developments, the cryptocurrency could see a path to $70,000 become more plausible.
Analysts have pointed to several factors that could potentially fuel a bullish breakout for Bitcoin. The expansion of Bitcoin ETFs and the anticipation of regulatory clarity are seen as significant catalysts. Additionally, the historical pattern of Bitcoin’s price increases following its halving events, along with potential Federal Reserve rate cuts, further support a bullish outlook.
Consolidation Continues as Bitcoin Approaches Historical Resistance Level
Over the past few weeks, the candlestick patterns in the market have displayed a combination of red and green candles with short bodies, suggesting that the market is in a consolidation phase. This phase, occurring near the 9-day exponential moving average (EMA) line, indicates market indecision. For a shift to a bullish breakout, the market would need to register a series of closing prices above the recent highs along with longer bullish candlesticks, signaling strong buying pressure.
Should Bitcoin maintain its upward momentum, it may encounter significant resistance near the $65,000 level, which has historically served as a pivotal point for both support and resistance. A decisive break above this level, accompanied by substantial trading volume, could potentially set the stage for a rise towards $70,000. Conversely, a failure to sustain the EMA as support might lead Bitcoin to revisit lower support levels, possibly around the $60,000 or $58,000 marks, areas previously identified as support zones in past trading activities.
Lastly, taking into account the current technical indicators and the macroeconomic environment, there remains a cautiously optimistic forecast for Bitcoin’s potential to achieve the $70,000 milestone. Although immediate significant price movements may not be forthcoming due to neutral momentum indicators, the latter half of 2024 holds potential. Market participants are expected to respond to evolving economic policies and other global financial dynamics, which could drive Bitcoin’s price upward.
The post When Will Bitcoin Reach $70,000? Bitcoin Price Technical Analysis appeared first on Coinfomania.