Bitcoin’s 200-day moving average breaks $50,000 for the first time
Quick Take
Bitcoin has primarily oscillated between the $60,000 and $70,000 range since late February, occasionally surpassing $70,000 to achieve its all-time high. However, it briefly dipped below $60,000 at the beginning of May.
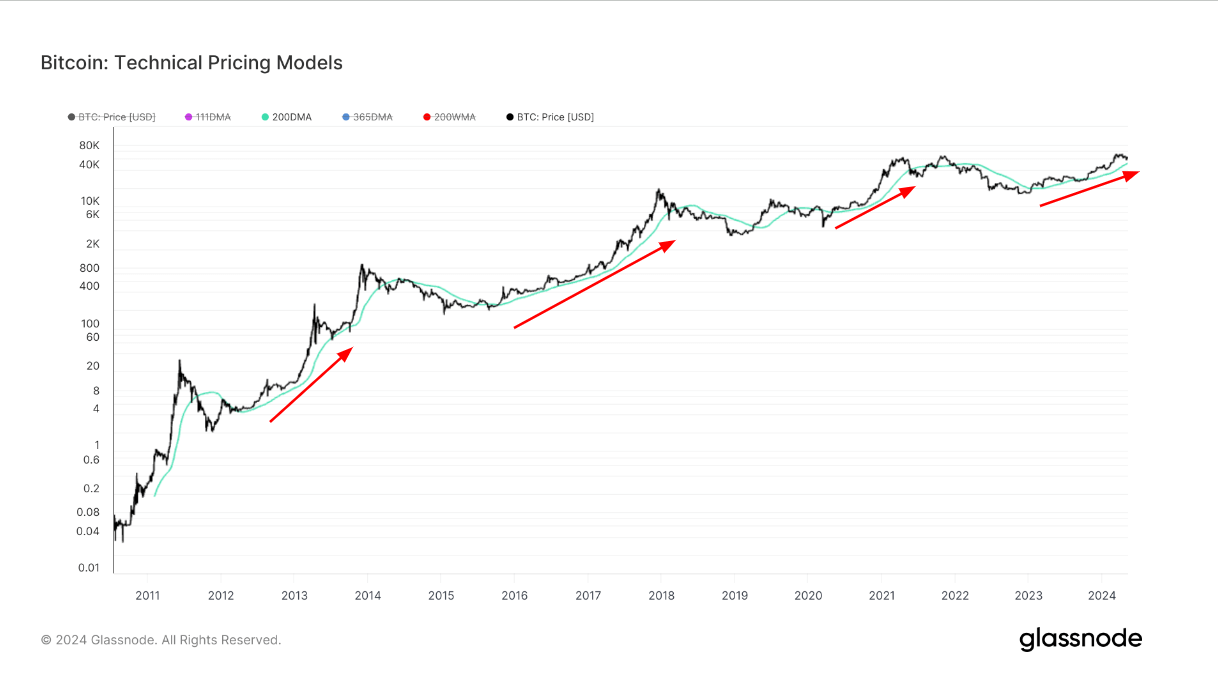
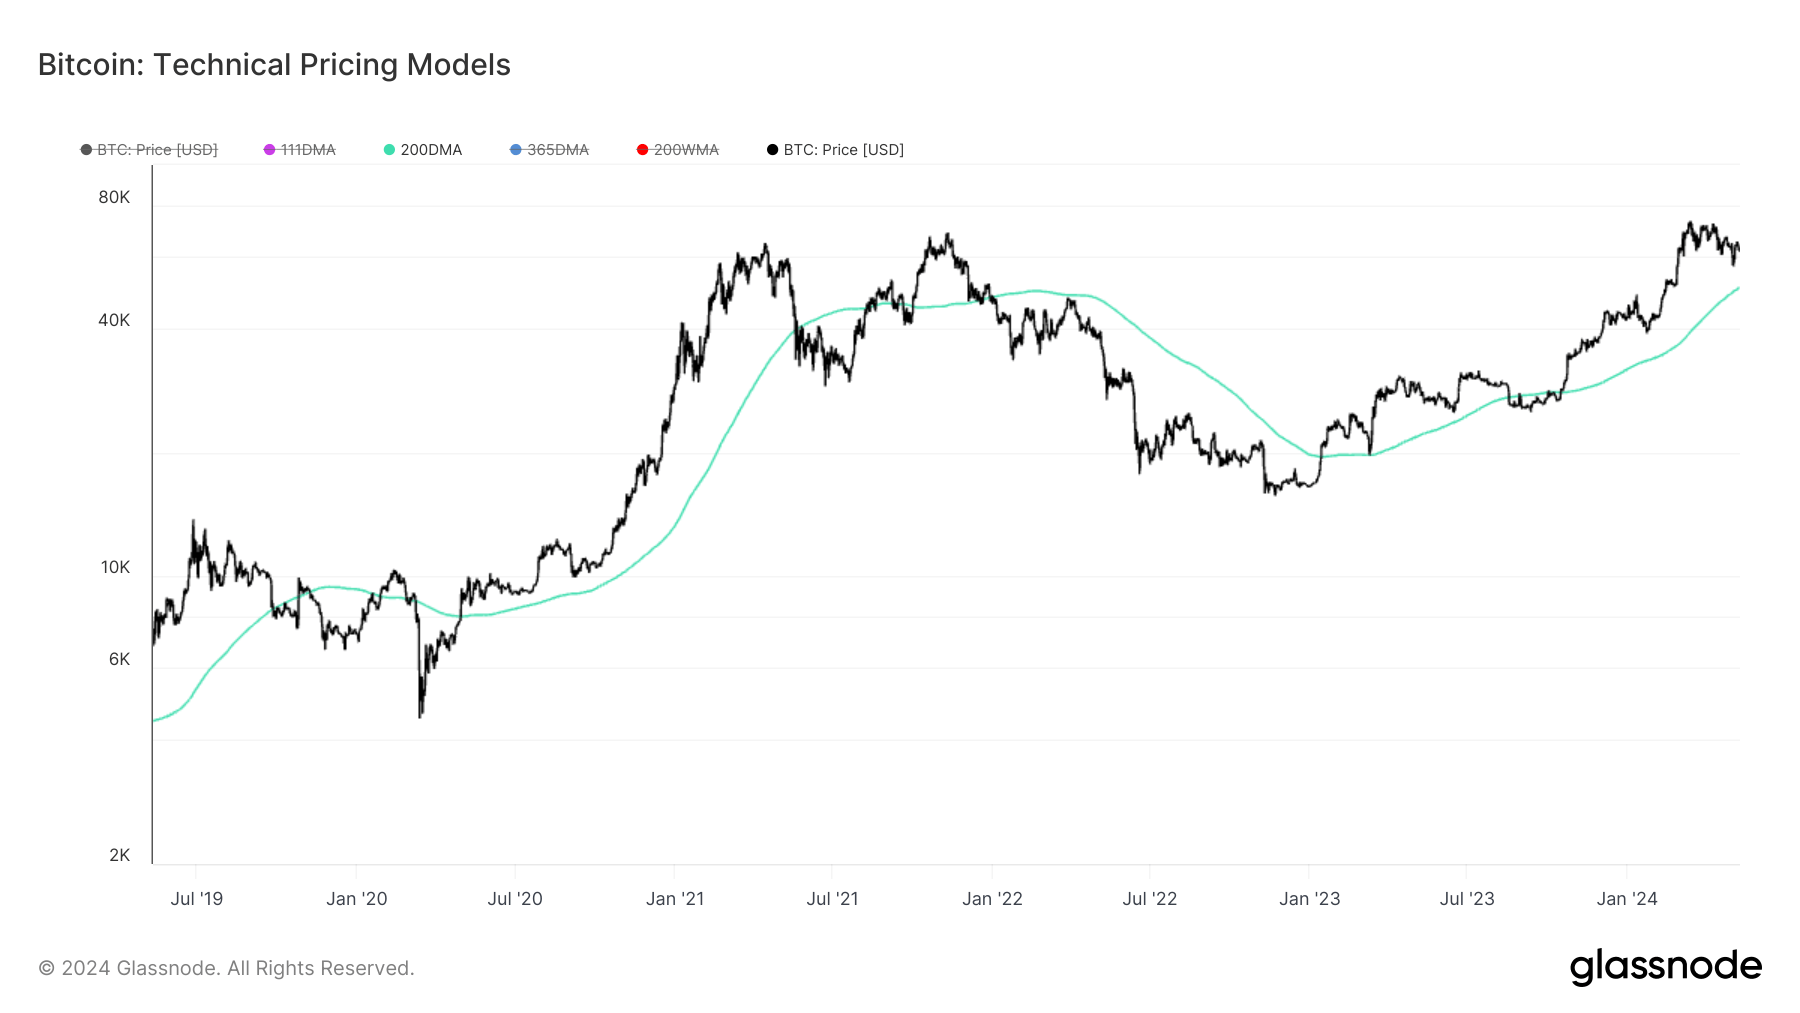
The 200-day moving average (DMA) recently breached the $50,000 mark for the first time on May 6, with Bitcoin currently hovering around $61,000. This milestone is significant as the 200DMA is widely regarded as a pivotal indicator delineating bull and bear market cycles.

In May 2021, Bitcoin dropped below the 200DMA level, which started the bear market. However, by January 2023, it had reclaimed this threshold, marking the commencement of the current bull run. A brief dip occurred below the 200DMA in October 2023, but it has remained a steadfast support since then.
In previous cycles, holding above the 200DMA was a bullish signal, while breaking down through it often presaged bearish momentum. Bitcoin’s ability to maintain prices over $50,443 could reinforce the uptrend.
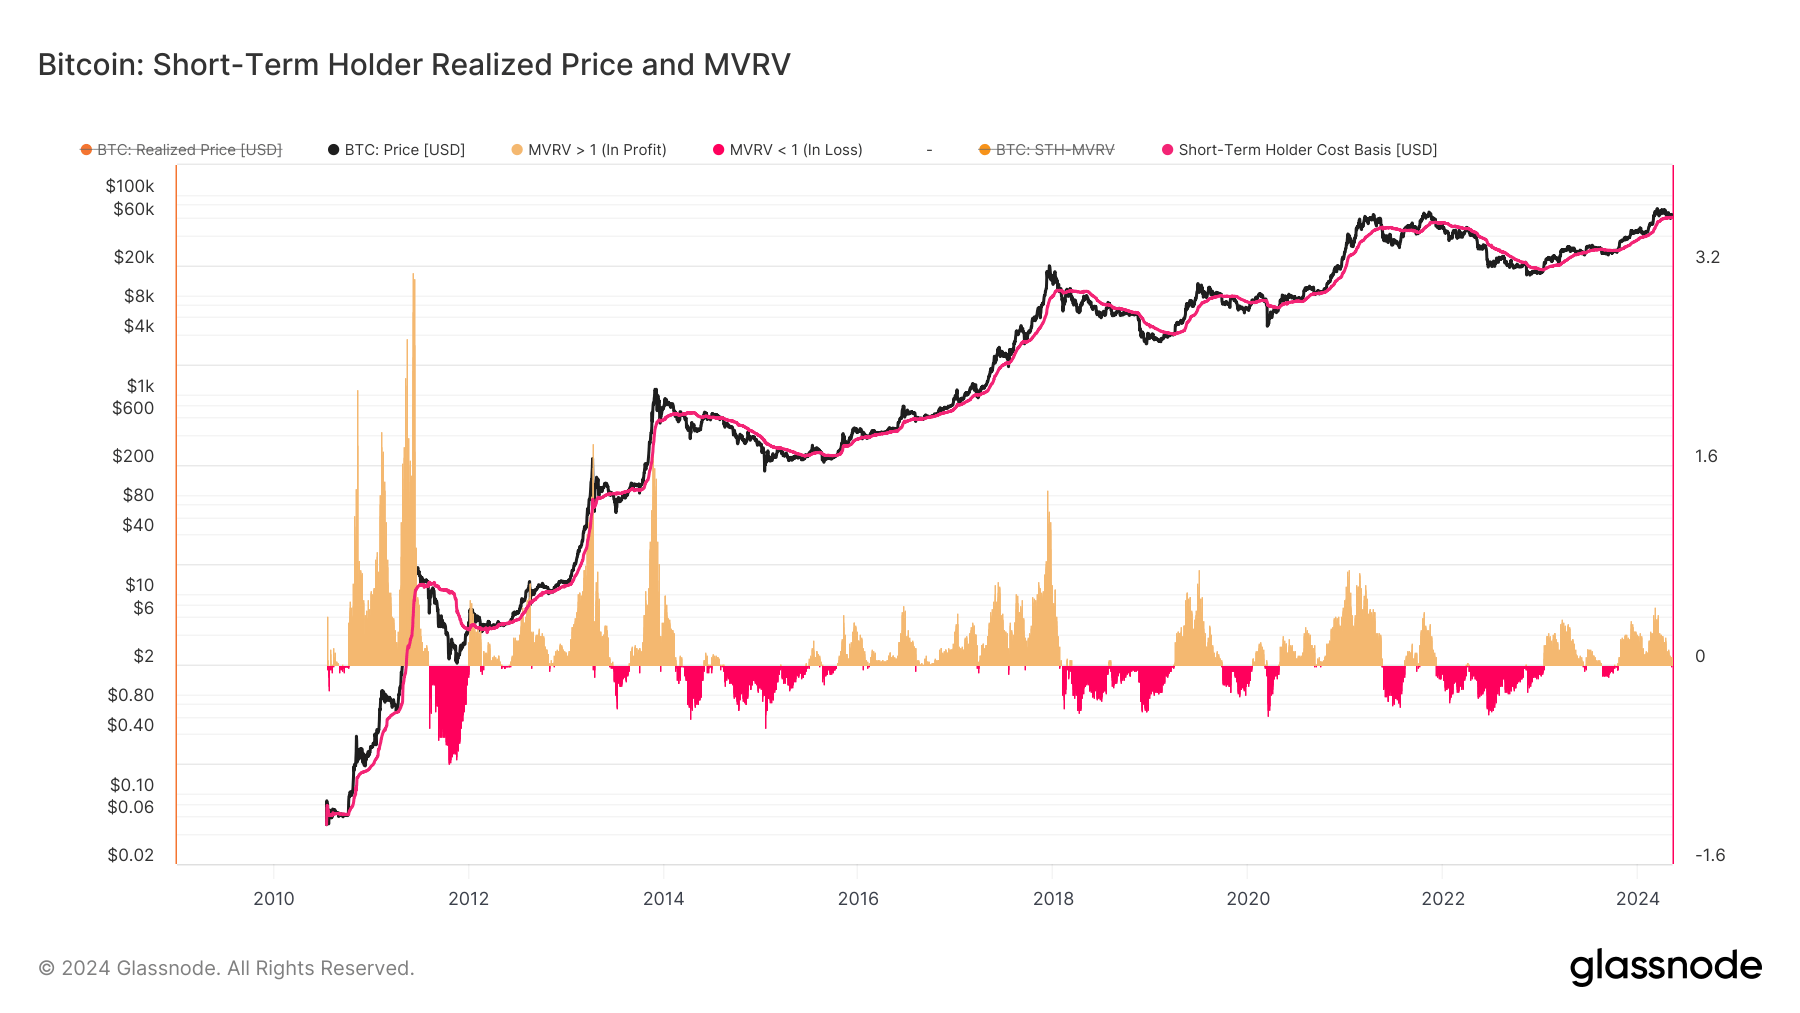
Meanwhile, the short-term holder’s realized price is on the verge of breaking $60,000.
The post Bitcoin’s 200-day moving average breaks $50,000 for the first time appeared first on CryptoSlate.